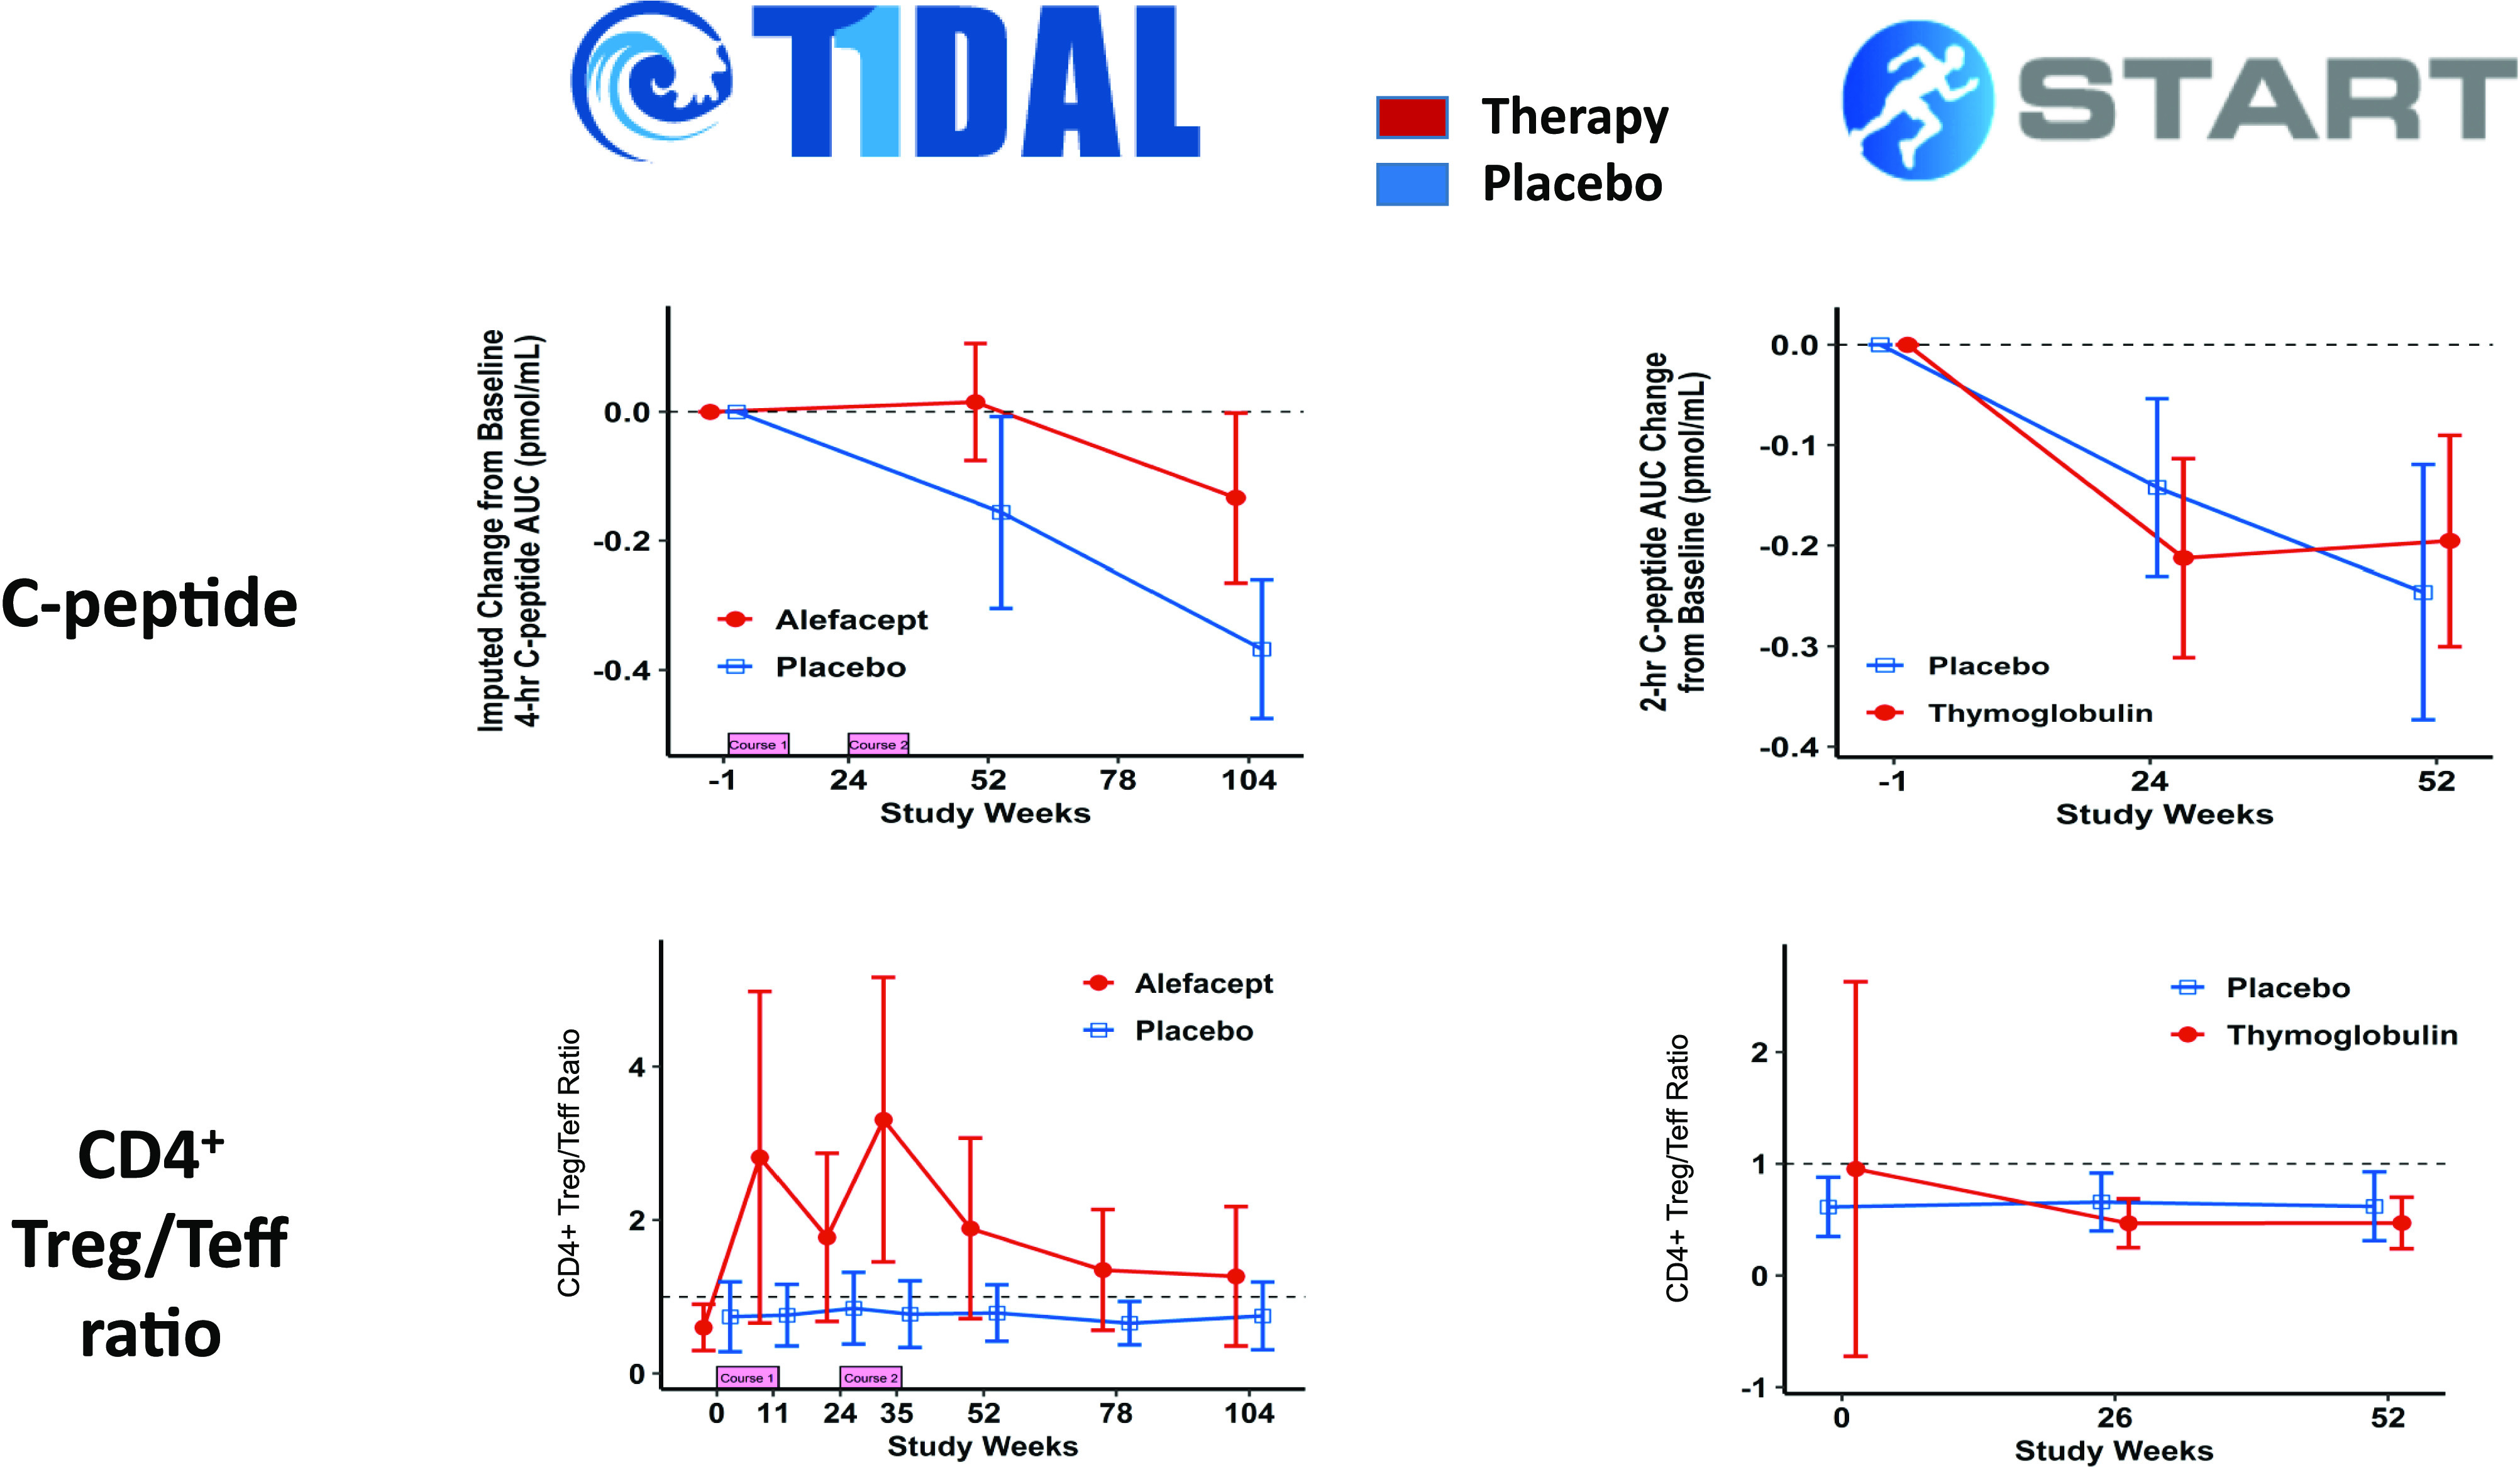
Figure 3.

Frequencies of regulatory T cells (Treg) and effector T cells (Teff) following use of anti–T-cell immunomodulatory therapy correlate with persistence or loss of insulin secretory capacity. Shown are stimulated C-peptide area under the curve (AUC) measurements from the T1DAL trial of alefacept (top left panel) and the START trial of ATG (top right panel), documenting transient preservation of β-cell function following alefacept treatment. The bottom panels display a ratio of the frequencies of regulatory and effector T lymphocytes in peripheral blood during these clinical trials, illustrating a marked increase in this ratio during the period of C-peptide preservation in T1DAL but not in START. Data are adapted from Rigby et al. (17) and Gitelman et al. (34).
