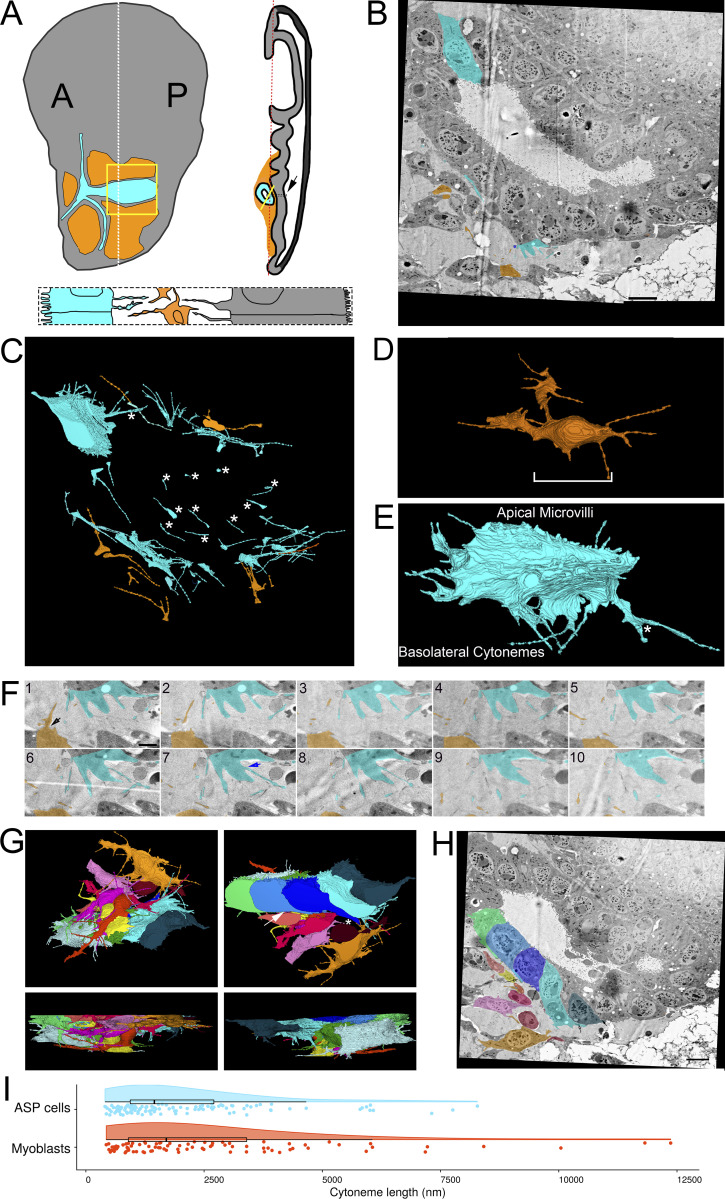
Figure 1.
Filopodia project from ASP epithelial cells and myoblasts. (A) Illustration depicting the Drosophila wing imaginal disc (gray), ASP (cyan), and myoblasts (orange) from frontal (left) and sagittal (right) perspectives. The dashed lines indicate the position of the sagittal (white) and frontal (red) sections. The solid yellow lines indicate the area shown in B. An enlargement (bottom) of the black box in the sagittal view depicts the microvilli on the apical surfaces, and filopodia on the basal surfaces, of both ASP and disc epithelial cells. The intervening myoblasts project filopodia in multiple directions. A and P indicated the anterior and posterior regions of the disc. (B) One section of 172 serial SEM images showing the ASP surrounded by myoblasts. Disc epithelial cells are visible in the top-right corner. Each image was segmented to highlight a portion of filopodia projecting from ASP (cyan) and myoblasts (orange). (C) Segmentation was used to create a 3D reconstruction of the filopodia projecting from ASP cells (cyan) and myoblasts (orange). One reconstructed ASP cell is included in the 3D rendering. Asterisks indicate filopodia projecting in the direction of cells of the same type. (D) A reconstructed myoblast projecting filopodia in multiple directions. The main cell body, marked along its length with a white bracket, is 15.4 × 5.9 × 2.4 µm (measured at the widest points). (E) A reconstructed ASP cell with microvilli on its apical surface and filopodia projecting from its basolateral surfaces. The asterisk indicates a filopodia, which bifurcates. The cell body, not including filopodia, is 12.2 × 5.09 × 4.68 µm (measured at the widest points). (F) An enlarged region from segmented serial SEM images showing filopodia projecting from an ASP cell and a myoblast in the direction of the other cell type. The black arrow (section 1) indicates a filopodia extending directly from the cell body, while the blue arrow (section 7) indicates a filopodia extending from a thick membrane extension. (G) Top, bottom, and side views of eight myoblasts (warm colors) and seven ASP cells (cool colors) reconstructed in 3D. The white asterisk indicates an example of extracellular space, and the white arrow indicates an area where myoblast and ASP cell membranes are apposed. (H) SEM image with segmentation of myoblasts and ASP cells corresponding to those in (G). The arrows point to thick extensions that extend from almost all ASP cells toward the ASP tip. (I) A raincloud plot of the lengths of filopodia extended by the 3D-reconstructed ASP cells and myoblasts. Data points for 113 ASP and 89 myoblast cytonemes are shown with probability distribution functions and box-and-whisker plots for each group. Scale bars: 5 µm (B), 500 nm (F), and 5 µm (H).

