Figure 3.
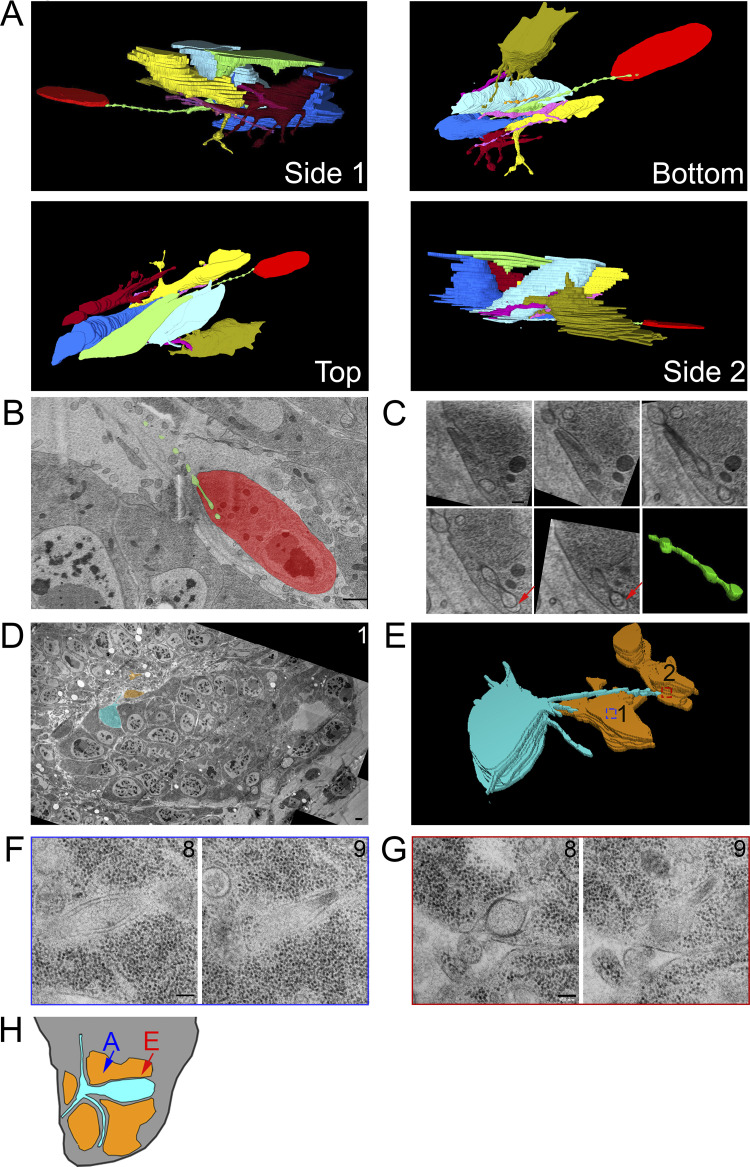
Myoblast and ASP cytonemes end in membrane invaginations of myoblasts. (A) Four perspectives of a 3D reconstruction of myoblasts and their cytonemes from 61 SEM images spanning a depth of 6.4 µm. The cytoneme extended by the green cell end in an invagination of the red cell membrane. (B) A segmented section showing the ending of the green cytoneme in a membrane invagination of the red cell. The blue arrow on the disc diagram (Fig. 3 H) shows the area imaged. (C) Higher magnification SEM images of the five serial sections containing the portion of the green cytoneme inside the red cell invagination. The sixth panel contains a 3D reconstruction of the part of the cytoneme inside the invagination, showing that it retains the same shape and structure when connected to the target cell. (D) One segmented TEM image montage highlighting an ASP cell (cyan) with two cytonemes that connect to two different myoblasts (orange). (E) 3D reconstruction of 10 segmented serial TEM images showing ASP cytonemes in contact with and invaginating into two myoblasts (labeled 1 and 2). The blue and red boxes mark the XY position of the end of each cytoneme and the area imaged at higher magnification. (F and G) High-magnification images showing the last two sections of the cytonemes in contact with myoblast #1 (F) and myoblast #2 (G). (H) A disc diagram indicating the positions of the segmented myoblasts shown in A (blue) and E (red). Scale bars: 1 µm (B), 200 nm (C), 1 µm (F), and 100 nm (G).

