Figure 4.
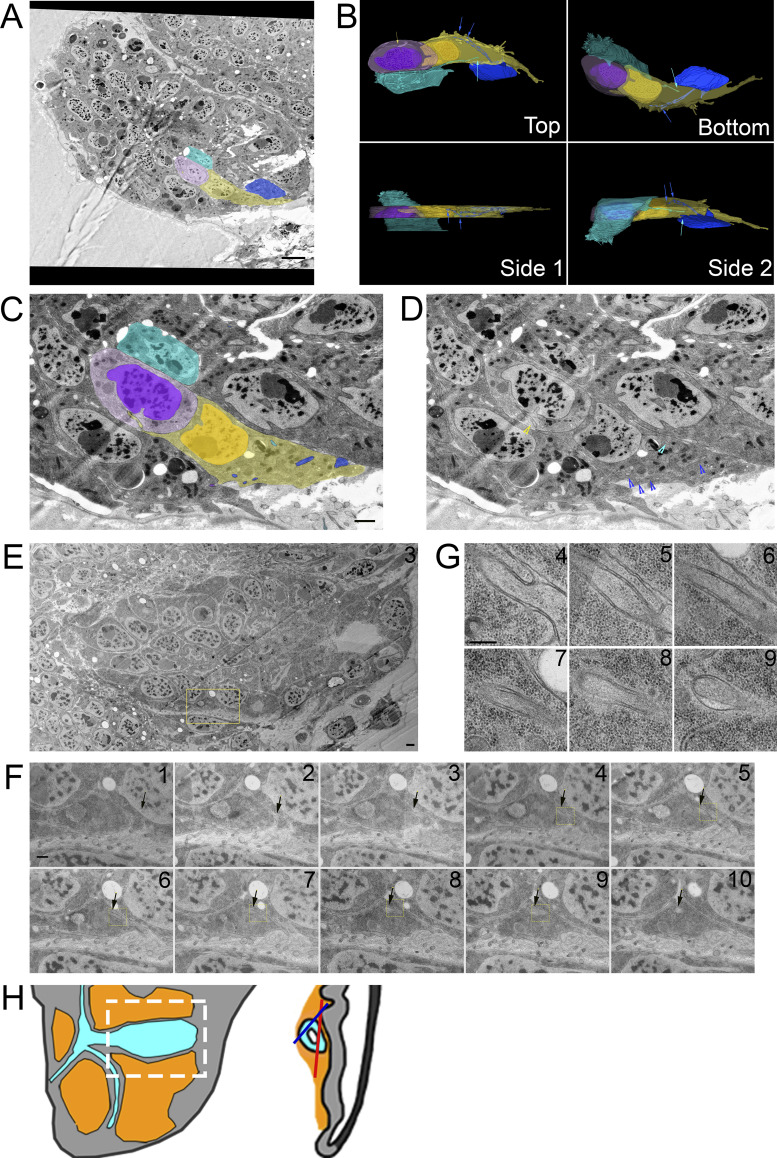
ASP cytonemes connect to neighboring ASP cells in membrane invaginations. (A) Four neighboring ASP cells visualized by serial SEM were segmented. The cyan cell was segmented throughout the entire stack, while the other cells were partially segmented to allow for visualization of their cytoneme connections in 3D. (B) Four perspectives of the 3D-reconstructed ASP cells showing cytonemes from the blue and cyan cell ending within an invagination of the yellow cell, while the yellow cell projects a cytoneme ending within the purple cell. The reconstructed volume containing the cells is 22.6 × 9.4 × 6.2 µm. (C and D) One segmented (C) and nonsegmented (D) section showing cytonemes inside membrane invaginations of neighboring cells. Arrowheads point to the cytonemes of corresponding color. (E) A TEM image montage of the ASP and surrounding myoblasts (location represented by white box and red line shown on disc diagrams in Fig. 4 H) shows a cytoneme from one ASP cell inside an invagination a neighboring cell. (F and G) A series of 10 image montages (enlargements of the boxed region of E) shows the cytoneme and its path (marked by arrows) within the membrane of the target cell. Boxed regions show the area imaged at higher magnification of sections 4–9 shown in G. (H) Both A (blue) and E (red) are images of the ASP and surrounding myoblasts (white box). The sagittal perspective shows the depth and angle of each section. Scale bars: 5 µm (A), 500 nm (C), 1 µm (E), 500 nm (F), and 200 nm (G).

