Figure 6.
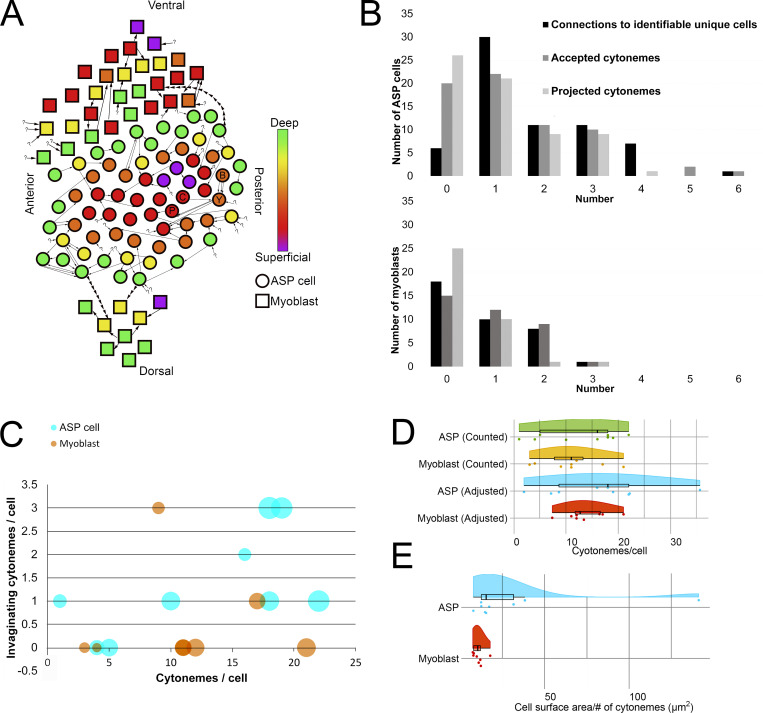
Intratissue cytonemes predominate in the ASP epithelium and myoblast population. (A) A map of the approximate position of 66 ASP cells (circles) and 37 myoblasts (squares) contained within the serial SEM stack and their connections to other cells. The color indicates the Z depth of each cell within the stack. Arrows begin at the cell from which a cytoneme originates and point toward the cell a cytoneme ends within. Question marks indicate invaginated cytonemes that could not be tracked back to a cell body. Positional labels (e.g., anterior) refer to the direction of the underlying disc compartments. The four cells segmented in Fig. 4, A–C, are indicated on the map with letters corresponding to their segmentation color (B, blue; Y, yellow; C, cyan; P, purple). (B) For each ASP cell (top) or myoblast (bottom), the number of connections (either sent or received invaginating cytonemes) to other verifiably unique cells, the number of invaginating cytonemes accepted, and the number of invaginating cytonemes projected to other cells were determined and graphed as a histogram. (C) For nine 3D-reconstructed ASP cells (cyan) and eight 3D-reconstructed myoblasts (orange), the number of total cytonemes was compared with the number of those cytonemes that made contact and invaginated another cell. The area of the dot representing each cell scales with the surface area of the reconstructed cell. (D) The number of cytonemes counted for each reconstructed cell along with the number of expected cytonemes if all cells were contained fully within the stack are shown as individual data points and summarized as box plots with the probability density function. The adjustment factor is based on the surface area of each cell compared with the surface area of a completely reconstructed cell of the same type. (E) The cell surface area per cytoneme for each reconstructed cell.

