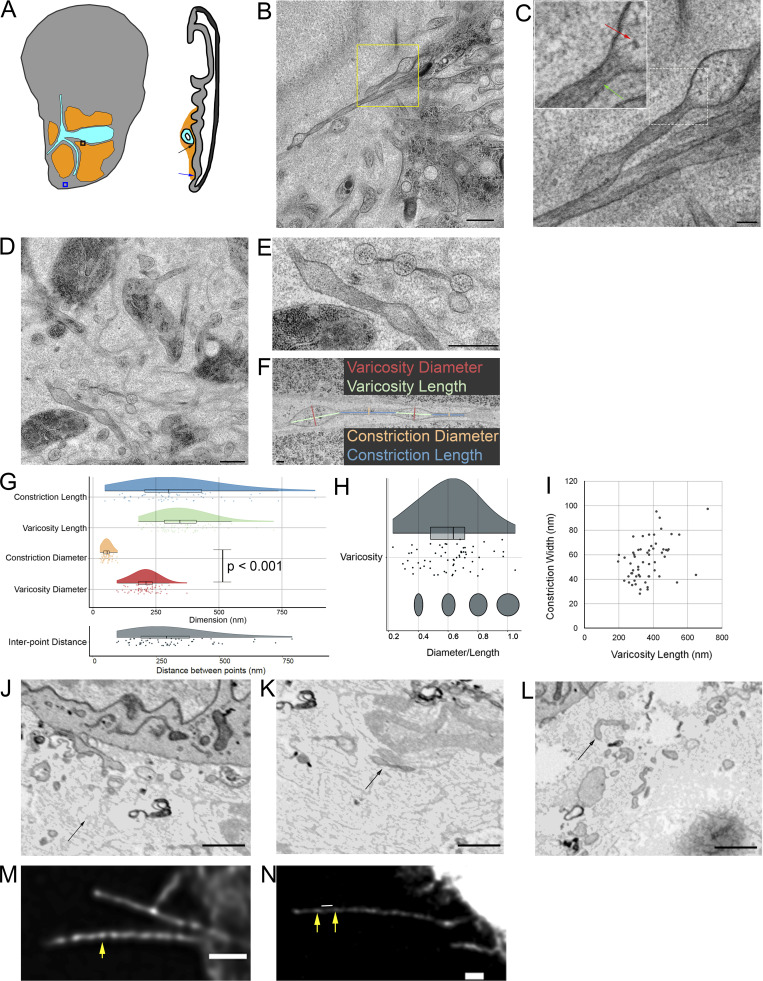
Figure 7.
Filopodia diameters vary between regions of varicosities and constrictions. (A) Boxes and arrows indicate the imaged area shown in B (blue) and D (black). (B) TEM image of two exemplar filopodia with regions of varicosities and constrictions extended by disc epithelial cells (blue arrow in A). (C) Higher magnification view of filopodia corresponding to dashed box in B. The inset is an enlargement of the area shown in the white dashed box. Ribosomes (red arrow) are visible in a varicosity, while actin filaments (green arrow) are visible in the constriction. (D) TEM image of filopodia among myoblasts (black arrow in A). (E) Enlargement of two filopodia from D showing the variance in size and shape of varicosities and constrictions. (F) The width and length of 64 varicosities and 60 constrictions of cytonemes projected by the ASP and myoblasts were measured as shown. (G and H) Raincloud plots of (G) filopodia dimensions measured from EM images (top) and compared with a two-sided t test, constriction lengths (n = 56) measured from filopodia of T-TRAP–expressing myoblasts (shown in N), and (H) ratio between width and length of varicosities (dark gray) and constrictions (light gray) measured from EM images. (I) Plot of constriction width versus varicosity length showing a moderate linear correlation (ρ = 0.42). (J) SEM image of a chemically fixed filopodium extending (arrow) from a disc epithelial cell with wide and narrow sections. (K) SEM image of a portion of a chemically fixed filopodium (arrow) with two varicosities separated by a constriction. (L) SEM image of a chemically fixed filopodium that does not show signs of having wide or narrow regions. (M and N) Deconvoluted CM images of filopodia projecting from live ASP cells expressing the membrane marker CD2-GFP (M) and a live myoblast expressing T-TRAP (N). Yellow arrows point to examples of points along the filopodia with greater diameter. The white line shown in N is an example of the measured distance between two points with greater diameter (shown in the fluorescence plot in G). Scale bars: 500 nm (B), 100 nm (C), 500 nm (D and E), 100 nm (F), and 1 µm (M and N).

