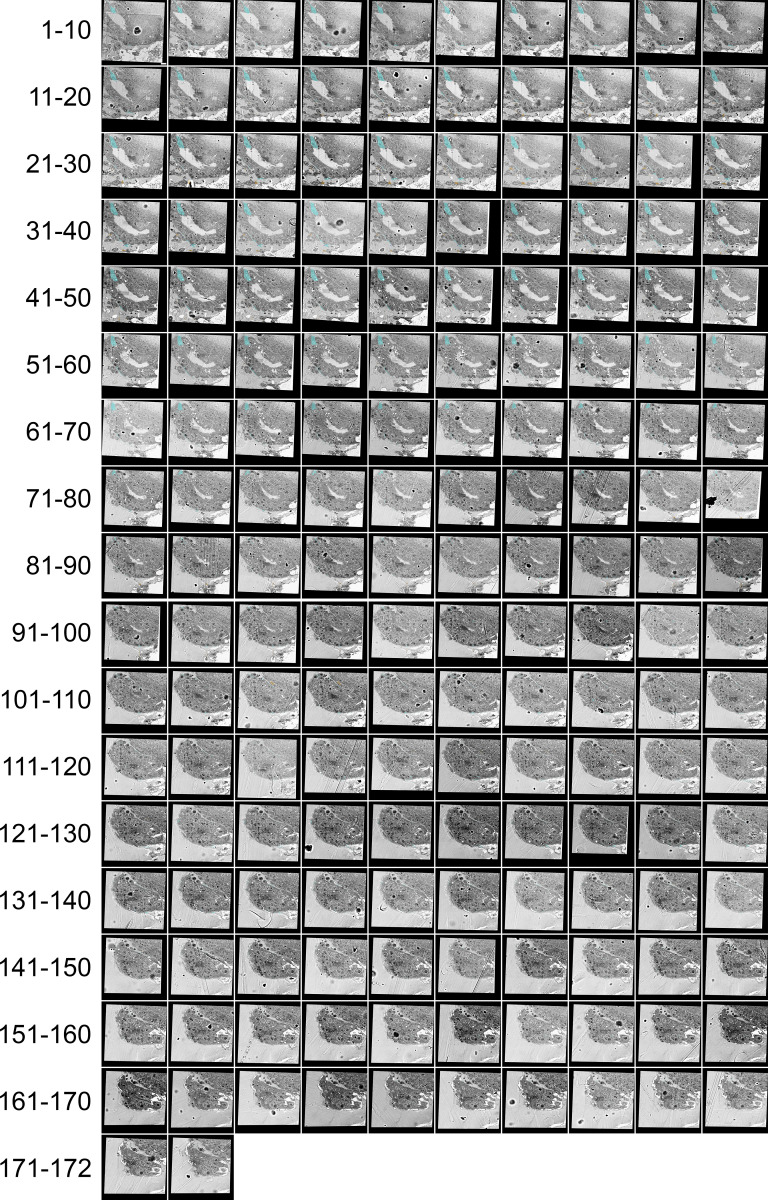
Figure S1.
ASP cells and myoblast project filopodia and cytonemes, which connect with target cells. Serial SEM images, including section 27 shown in Fig. 1 B. A portion of ASP cytonemes and one cell (cyan) and myoblast cytonemes (orange) are shown segmented. Image resolution has been scaled by 50%. Scale bar: 5 µm.

