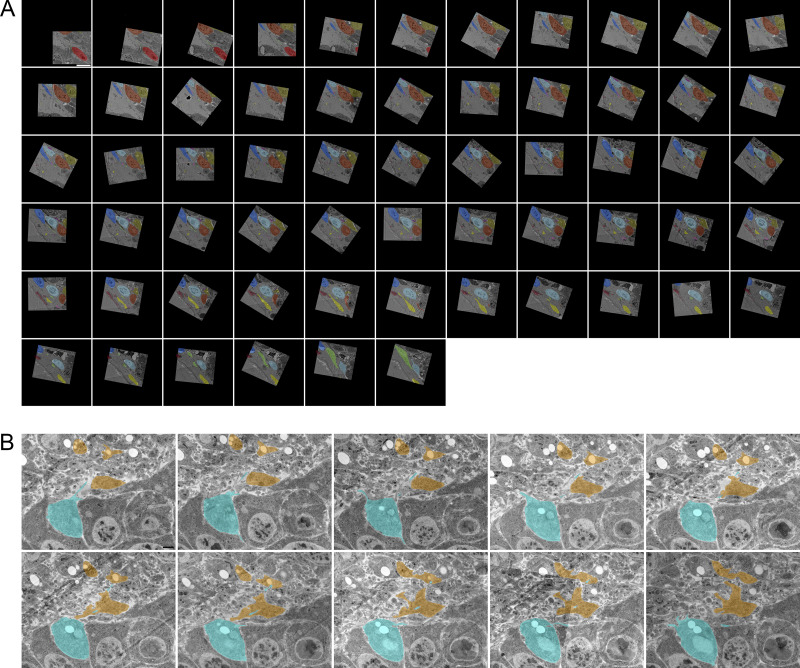
Figure S3.
Myoblasts are connected by cytonemes to other myoblasts and ASP cells. Serial SEM images, including section 1 shown in Fig. 3 A. (A) Individual myoblasts and their cytonemes were segmented in different colors. The segmentation was used to produce the 3D rendering in Fig. 3, A and C. (B) Serial TEM images showing the area segmented to produce the 3D rendering in Fig. 3 E. The series is a partial view of larger montages used to create each section. A full montage of section 1 is shown in Fig. 3 D. Images are in serial order from left to right and top to bottom. Scale bar: 5 µm (A), 1 µm (B).

