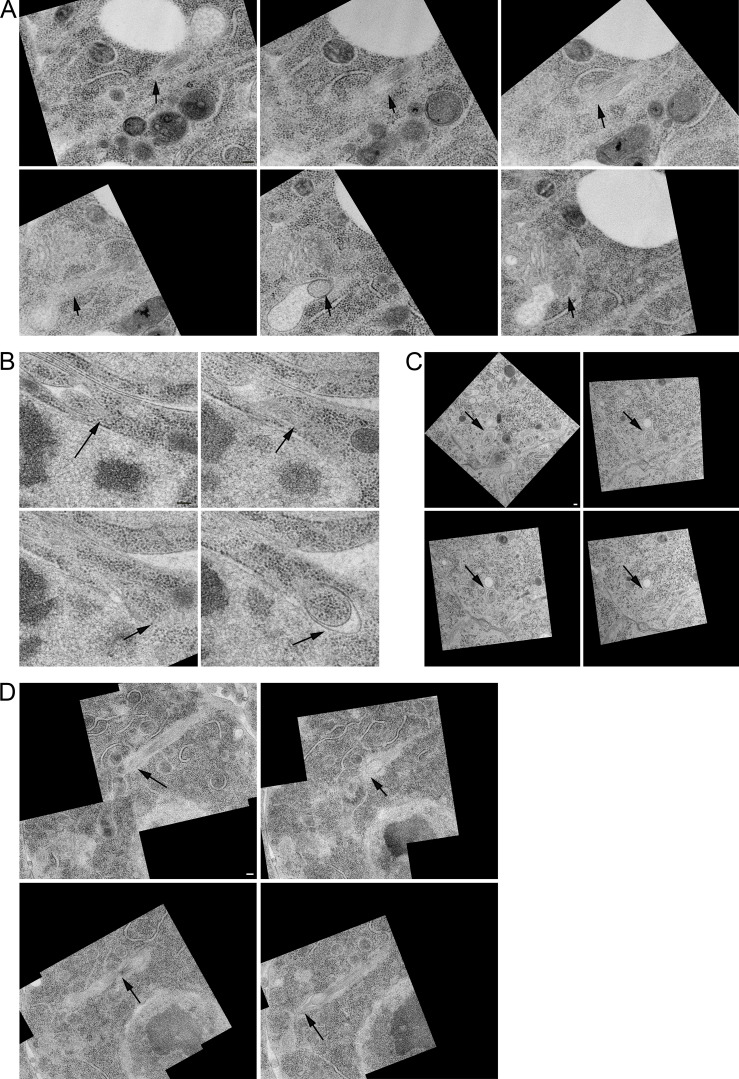
Figure S4.
Cytonemes end in membrane invaginations of target cells. (A–D) High magnification views of the cytonemes shown in Fig. 5 D panel 1 (A), panel 2 (B), panel 3 (C), and panel 4 (D) of cells. Arrows point to the leading edge of the cytoneme in each section. Images are in serial order from left to right and top to bottom. Scale bars: 100 nm.

