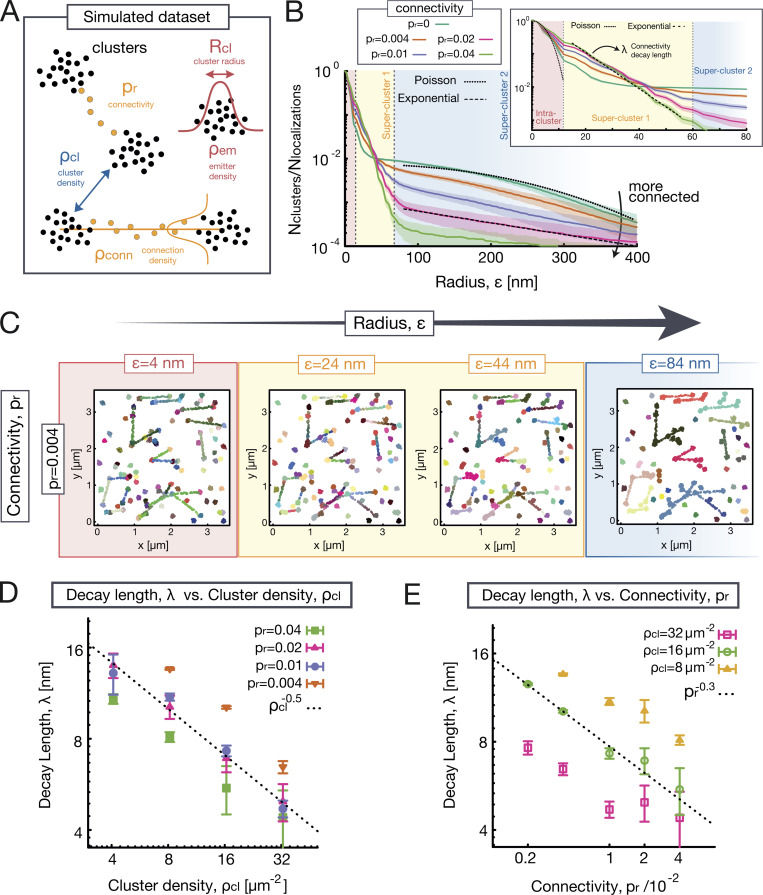
Figure 2.
Evaluating SuperStructure on simulated datasets. (A) Sketch representing the artificial dataset consisting of interconnected clusters of localizations on a 2D plane. Clusters are characterized by an internal density of localizations and radius and are randomly distributed on the plane at an average cluster density Clusters can be connected by a sparse point distribution with probability and connections have a density of points (controlled by the parameter). (B) Average SuperStructure curves (zoomed in the inset) for simulated datasets with different connectivity Other parameters are kept fixed: average cluster radius emitter density within clusters cluster density and (which fixes the density of emitters within connections The curves show the number of detected clusters normalized by the total number of localizations. Curves are the average of 20 independent simulated datasets. Shaded regions represent the standard deviation from the average. Three regimes can be distinguished: (1) the intra-cluster (red), (2) the first super-cluster (yellow), and (3) the second super-cluster (blue). The decay in the intra-cluster regime corresponds to a Poisson avoidance function with density parameter (Eq. 1, dotted line in the inset). The first super-cluster regime can be fitted by a single exponential (Eq. 4, dashed line in the inset) which returns an effective decay length The second super-cluster regime can be fitted with another exponential if (Eq. 4, dashed line in the main figure). In case of there is only one super-cluster regime, and it follows a Poisson function with density parameter (Eq. 3, dotted line in the main figure). (C) Snapshots of detected clusters for an artificial dataset with connectivity and by progressively increasing the value of the radius (D) Decay length versus cluster density scales as for any value of connectivity (E) Decay length versus connectivity scales as for different values of In D and E, 20 independent datasets were fitted with Eq. 4, and the resulting values were averaged. Vertical bars represent the standard deviation from the average.

