Figure 2.
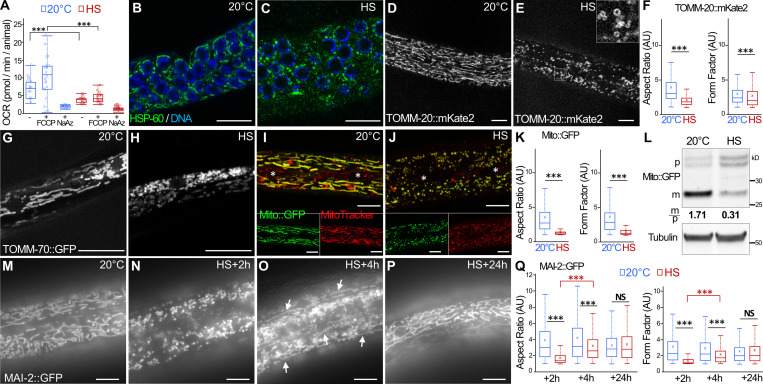
aHS induces transitory fragmentation and dysfunctions of mitochondria. (A) Oxygen consumption rate (OCR) in control and HS animals. FCCP, cyanide-4(trifluoromethoxy)phenylhydrazone; NaAz, sodium azide. Boxplot, triplicates 15 < n < 22; ***, P < 0.001, Wilcoxon test. (B and C) Confocal images of mitochondrial network in the gonad (anti-HSP60 staining) of control (B) and HS (C) animals. DNA of germ cells is stained with Hoechst (blue). (D–F) Confocal images of the mitochondria in the epidermis, visualized with mKate2 fused with the outer membrane localization domain of TOMM-20, in control (D) and HS (E) animals. Quantification of the mitochondrial shape descriptors aspect ratio and form factor using TOMM-20::mKate2 (F). Boxplot showing a total of 200–500 mitochondria analyzed from five animals. ***, P < 0.001, Wilcoxon test. (G and H) Confocal images of the mitochondria in the muscle visualized with GFP fused with the outer membrane localization domain of TOMM-70 in control (G) and HS (H) animals. (I–K) Colocalization of mito::GFP (green) and MitoTracker CMXRos (red) in the epidermis of control (I) and HS (J) animals. The white asterisks show the positions of the specialized seam cells of the epidermis that do not express Mito::GFP but are labeled with CMXRos. Quantification of the mitochondrial shape descriptors aspect ratio and form factor using Mito::GFP (K). Boxplot showing >300 mitochondria measured per animal from five animals. ***, P < 0.001, Wilcoxon test. (L) Western blot analysis of epidermal Mito::GFP. The quantification of the cytoplasmic precursor (p) and mitochondrial (m) forms shows a decrease of the GFP import after HS. (M–Q) Epifluorescence images of MAI-2::GFP showing the mitochondria in the epidermis in control (M) and HS after 2-h (N), 4-h (O), or 24-h (P) recovery. The rebuilding of the network is visible 4 h after HS by the presence of tubular mitochondria (white arrows). The quantification of the mitochondrial shape descriptors (aspect ratio and form factor) indicates a partial rebuilding after 4 h of recovery (Q). Boxplot, five animals were analyzed, and >500 mitochondria were measured per animal. ***, P < 0.001, Wilcoxon test. The scale bars are 10 µm.

