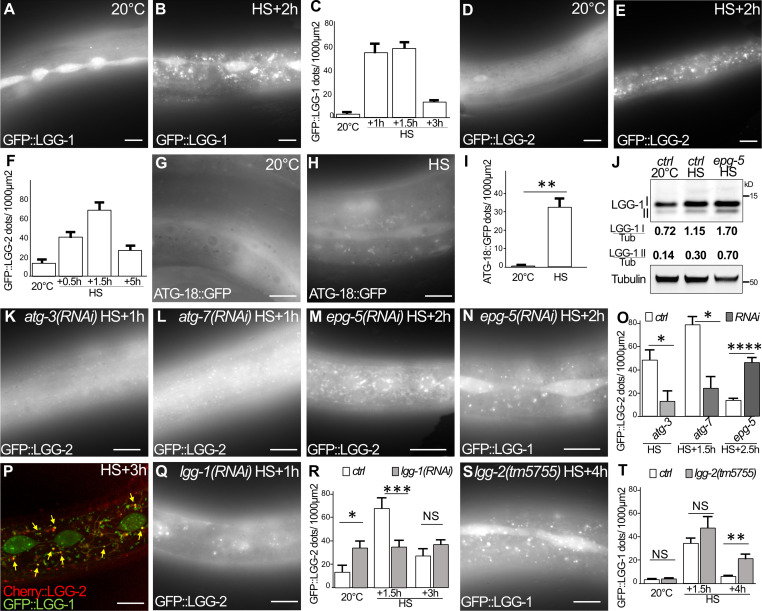
Figure 3.
aHS induces an autophagic flux in the epidermis. (A–F) Autophagosomes are visualized with GFP::LGG-1 (A and B) or GFP::LGG-2 (D and E) in control (A and D) and HS (B and E) animals and quantified (mean ± SEM; n = 10, 8, 11, 11 in C; n = 13, 10, 10, 8 in F). (G–I) The initiation sites of autophagosomes are visualized with ATG-18::GFP after 30-min treatment in control (G) and HS (H) animals and quantified (I; mean ± SEM, n = 7, 6; **, P < 0.005, Wilcoxon test). (J) Western blot analysis using anti–LGG-1 antibody to quantify the cleaved (I) and lipidated (II) forms. aHS induces an increase of the autophagic flux with a further accumulation of lipidated LGG-1 in epg-5(RNAi) animals where maturation of autophagosomes is altered. (K–O) The autophagic flux induced by HS was analyzed by imaging of GFP::LGG-2 or GFP::LGG-1 autophagosomes in the autophagy-deficient animals atg-3 (K), atg-7 (L), and epg-5 (M and N) and quantified (O; mean ± SEM, n = 5, 5, 4, 5, 7, 11; *, P < 0.05; ****, P < 0.0001, Wilcoxon test). (P–T) LGG-1 acts upstream of LGG-2 during aHS autophagic flux. Three types of autophagosomes are detected after HS: LGG-1 only (green), LGG-2 only (red), and double positive (yellow arrows; P). The depletion of lgg-1 (Q and R) decreases the number of LGG-2 autophagosomes, while the depletion of lgg-2 (S and T) increases the number of LGG-1 autophagosomes. Mean ± SEM; n = 13, 10, 10, 10, 8, 8; *, P < 0.05; **, P < 0.005; ***, P < 0.0005, two-way ANOVA. The scale bars are 10 µm.

