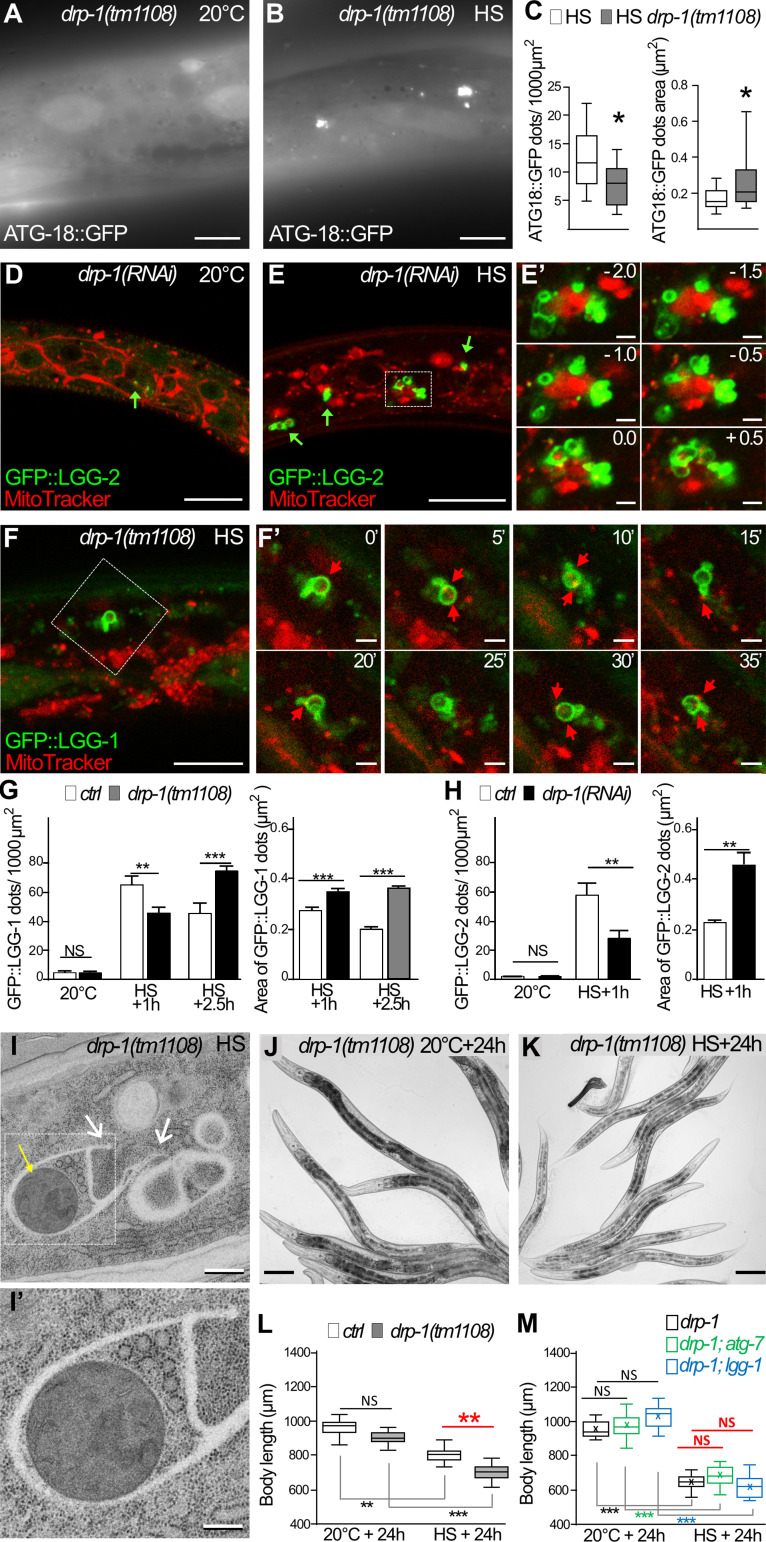
Figure 7.
DRP-1 is necessary for functional autophagy after aHS. (A–C) The initiation sites of autophagosomes are visualized with ATG-18::GFP in the epidermis of drp-1 animals at 20°C (A) and after HS (B). Upon HS, the initiation of autophagy is triggered in drp-1 animals, but ATG-18 puncta are clustered (compare with Fig. 3, G and H, for a wild-type control). (C) Boxplots showing the number and the area of puncta (n = 13, 14; *, P < 0.05, Wilcoxon test). (D and E) Confocal images of mitochondria stained with MitoTracker (red) and autophagosomes visualized with GFP::LGG-2 (green) in the epidermis of drp-1 animals at 20°C (D) and after aHS (E). Insets in E′ are a 0.5-µm Z-series corresponding to the dotted square in E. After aHS, the drp-1–depleted animals display abnormal autophagosomes (green arrows) that clustered and intermingled with mitochondria. (F) Confocal time-lapse images of mitochondria stained with MitoTracker (red) and autophagosomes visualized with GFP::LGG-1 (green) in the epidermis of drp-1(tm1108) mutant after aHS. F′ shows time lapse images, corresponding to the dotted square in F, captured every 5 mins. Despite changes in their morphology, the abnormal autophagosomes are persistent. (G and H) Quantification of the number and the area of LGG-1– and LGG-2–positive structures in drp-1 animals at 20°C or after aHS (G, mean ± SEM, n = 19, 16, 12, 11, 10, 10, 12, 11, 10, 10, two-way ANOVA; H, mean ± SEM, Wilcoxon test, n = 10, 4, 9, 10, 11, 10; **,P < 0.005; ***, P < 0.0005). (I) EM picture of mitochondria (yellow arrow) and cytoplasmic material engulfed in membranous structures in the epidermis of a drp-1 animal after HS. Membranous nonclosed extensions are visible (white arrows). I′ is a zoom of the dotted square in I. (J–L) The depletion of DRP-1 exacerbates the developmental phenotypes induced by aHS. ctrl (see Fig. 1) and drp-1(tm1108) (J and K) animals were maintained at 20°C or submitted to aHS, and their body size was analyzed after 24-h recovery (L; boxplot, n = 9, 13, 8, 13; **, P < 0.001, Kruskal-Wallis test). (M) Blocking autophagy in drp-1 mutants does not further increase the developmental delay after aHS. ctrl(RNAI), atg-7(RNAi), or lgg-1(RNAi) were applied to drp-1(tm1108) animals at 20°C or submitted to aHS, and the size of the animals was measured after 24 h (boxplot, n > 10, Kruskal-Wallis test). The scale bars are 10 µm (A–F), 1 µm (E′), 2 µm (F′), 0.5 µm (I), 0.5 µm (I′) and 100 µm (J and K).

