Figure S1.
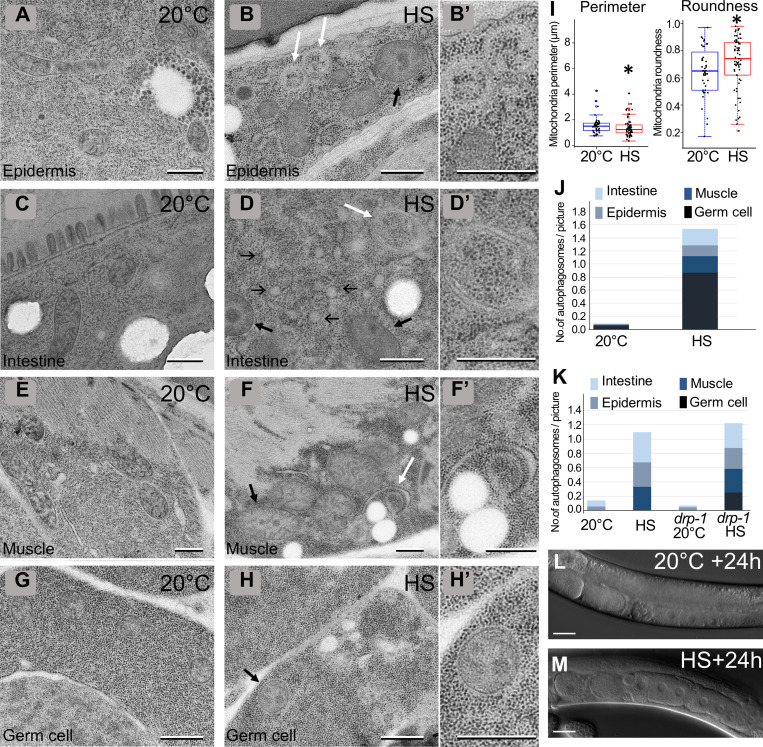
Characterization of cellular defects after aHS (complementary to Fig. 1). (A–H) TEM images of epidermis (A and B), intestine (C and D), muscle (E and F), and germ cells (G and H) in control (A, C, E, and G) and HS (B, D, F, and H) L4. Thin black arrows, thick black arrows, and white arrows point to ER, mitochondria, and autophagosomes, respectively. (B′, D′, F′, and H′) Higher magnification of the area shown by white arrows in B, D, and F and a black arrow in G, respectively (I–K) Boxplots showing the quantification of the mitochondrial shape (I; *, P < 0.05, Kruskal-Wallis nonparametric test; n = 40, 65) and the numbers of autophagosomes in young adults (J; n = 156, 55) and L4 (K; n = 63, 90, 101, 94). (L and M) DIC pictures of the gonads of control (L) or aHS (M) animals. aHS results in a developmental delay but no sterility. The scale bars represent 0.5 µm (A–H, B′, D′, F′, and H′) or 20 µm (L and M).

