Figure 3.
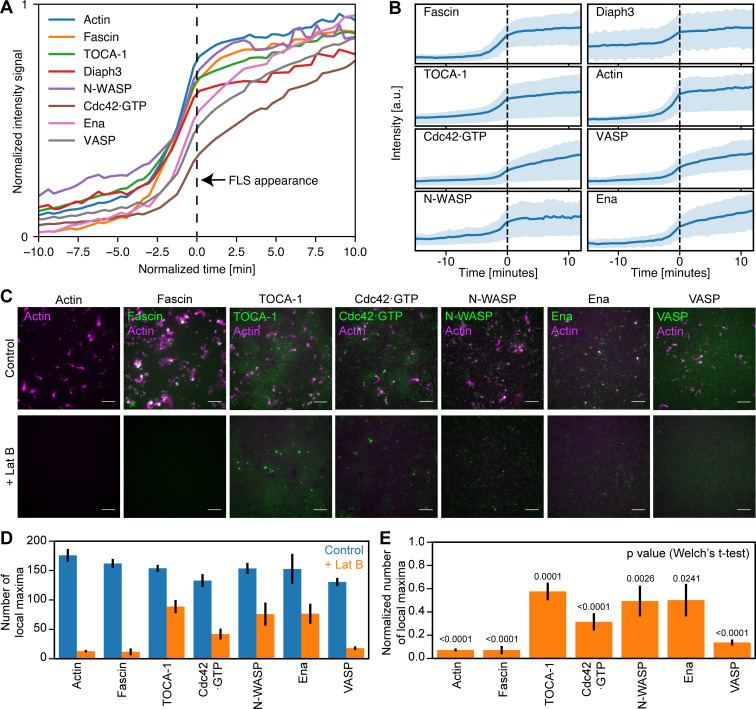
Actin regulatory proteins assemble cooperatively to polymerize actin bundles. (A) Mean intensity of accumulation in actin regulators over time as FLSs form combined from the experiments listed in Table 1: Actin n = 19,974; Fascin n = 2,898; TOCA-1 n = 19,893; Diaph3 n = 3,811; N-WASP = 1,743; Cdc42•GTP n = 7,839; Ena n = 1,828; and VASP n = 1,857. (B) Shaded area is the standard deviation of protein accumulation data from A. (C) LatB treatment reduces TOCA-1, Ena, and N-WASP foci on the membrane and inhibits recruitment of fascin and VASP, with partial inhibition of Cdc42•GTP localization. Scale bars = 10 µm. (D) Quantification of number of local maxima computed by protein fluorescence intensities plus and minus LatB. Error bars are the SEM. FLSs are from 8–15 fields of view of more than three independent experiments, and a normal distribution was assumed. (E). The fraction of local maxima when LatB was added normalized to the control. P values are from two-sided Welch’s t test. Error bars represent SEM.

