Figure 7.
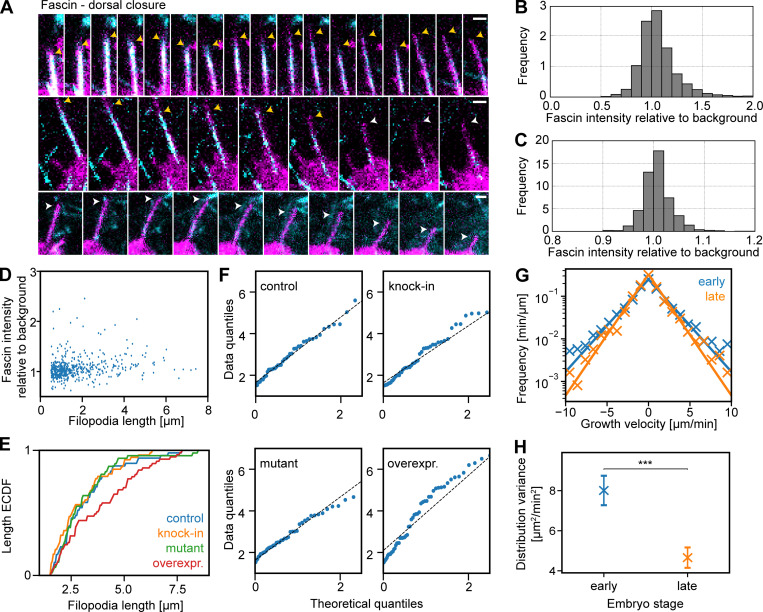
Heterogeneous levels of fascin and corresponding length distributions in vivo. (A) Time-lapse montages of maximum-intensity projections every 15 s of filopodia in leading edge cells in dorsal closure in the Drosophila embryo. Endogenous fluorescent Fascin is in cyan and membrane marker in magenta. Yellow and white arrowheads indicate filopodia with and without fascin. Scale bars = 1 µm. (B) Histogram of Fascin fluorescence intensity normalized to local background in filopodia, set to 1 (n = 3,432). (C) Histogram of Fascin fluorescence intensity normalized to local background in FLS shafts (n = 1,515). Most filopodia and FLSs only show background levels of fluorescence, with few at higher intensities. (D) Scatterplot of fascin intensity in filopodia shafts versus maximal filopodia length in leading edge cells in dorsal closure (n = 519). (E) Cumulative frequency plot (empirical cumulative distribution function, ECDF) of filopodia lengths with mutant (n = 47), wild-type (n = 48), knock-in GFP-Fascin (n = 53), and overexpressed (overexpr.) GFP-Fascin (n = 57) in dorsal closure leading edge filopodia. P values compared with control with two-sample Kolmogorov-Smirnov test: labeled Fascin, P = 0.765; mutant Fascin, P = 0.996; and Fascin overexpression, P = 0.047. (F) Q:Q plots show that control, labeled (knock-in) fascin, and mutant fascin filopodial lengths are consistent with an exponential distribution, but Fascin overexpression is not. (G) Lateral transverse myotube filopodial growth velocity distribution in stage 15 (early, n = 191) and stage 16 (late, n = 121). Crosses indicate experimentally derived data, and solid lines show maximum likelihood fits of a Laplace distribution. (H) Laplace distribution variances shown as crosses. Error bars indicate the 95% confidence intervals. The distributions for early and late stages are significantly different (***P = 0.00028, two-sample Kolmogorov-Smirnov test). Data are from four time-lapse movies each. Colors are the same as in G.

