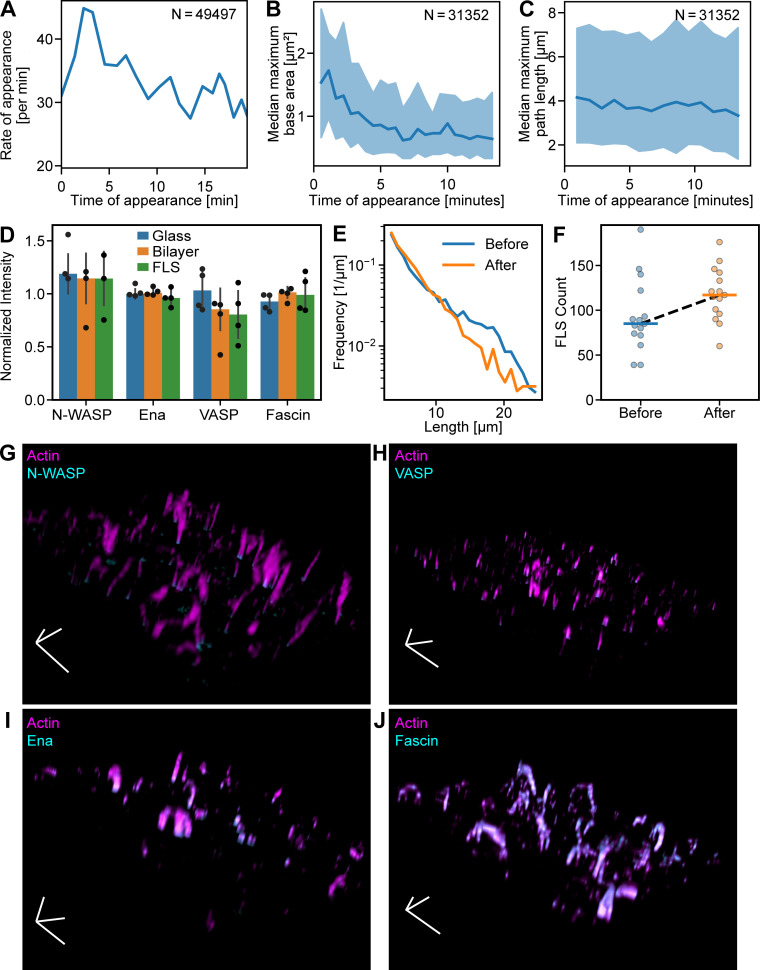
Figure S2.
FLS appearance and morphology over time. (A) Rate of appearance of FLSs with time. (B) FLSs that arise early in the experiment end up slightly larger. (C) The lengths of FLSs that arise early and late are similar. Shaded areas in all graphs are the standard deviation. (D) Western blot quantification of N-WASP, Ena, VASP, and Fascin in FLS assay mix after incubation on coverslip glass surface, supported lipid bilayer, and after an FLS assay was performed for 20 min, normalized to the loading control (fluorescent actin) and to the protein intensity in the preincubation mix (n = 4 for each condition). Proteins were not appreciably depleted in any of the conditions. Error bars indicate SD. (E and F) FLS length distribution (E) and FLS count (F) from assays incubated for 20 min as usual (“Before”, n = 3,010) and by reusing the reaction mix from an assay to start another assay (“After”, n = 2,905). FLS length shows an approximate exponential distribution in both cases, and the numbers of FLSs were not reduced. Horizontal lines in F indicate the mean count. (G–J) Example images from FLS assays with actin (magenta) and immunostained N-WASP (G), VASP (H), Ena (I), and Fascin (J; all cyan). Scale tripod indicates 10 µm along each axis.

