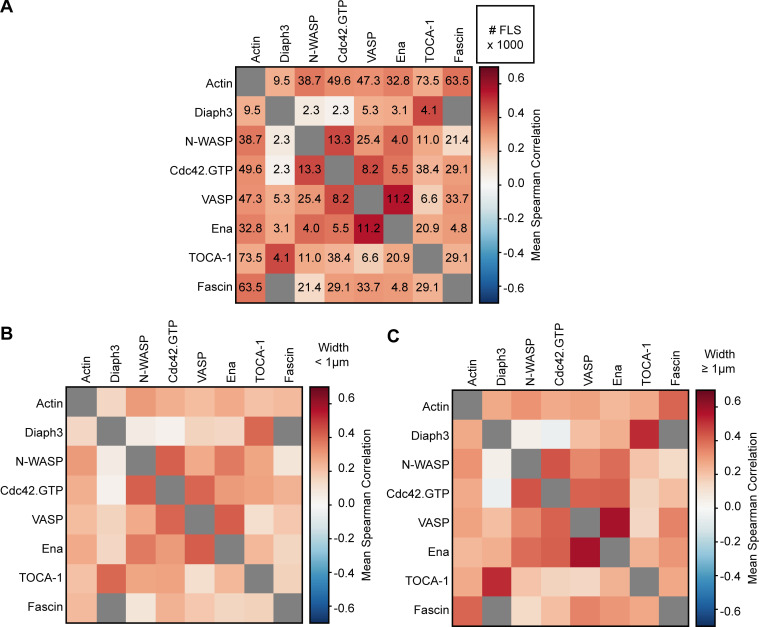
Figure S3.
Positive correlations between actin regulators. (A) The correlation value matrix from Fig. 2 B with numbers of FLSs (lower right, in thousands). (B) Correlations between pairs of actin regulatory proteins for FLS tip complexes with an effective diameter below 1 μm. The color scale is the same as in Fig. 4 B. (C) Same as above for tip complexes with a diameter above 1 μm. The pattern of weak and stronger correlations is the same for both larger and smaller FLSs.

