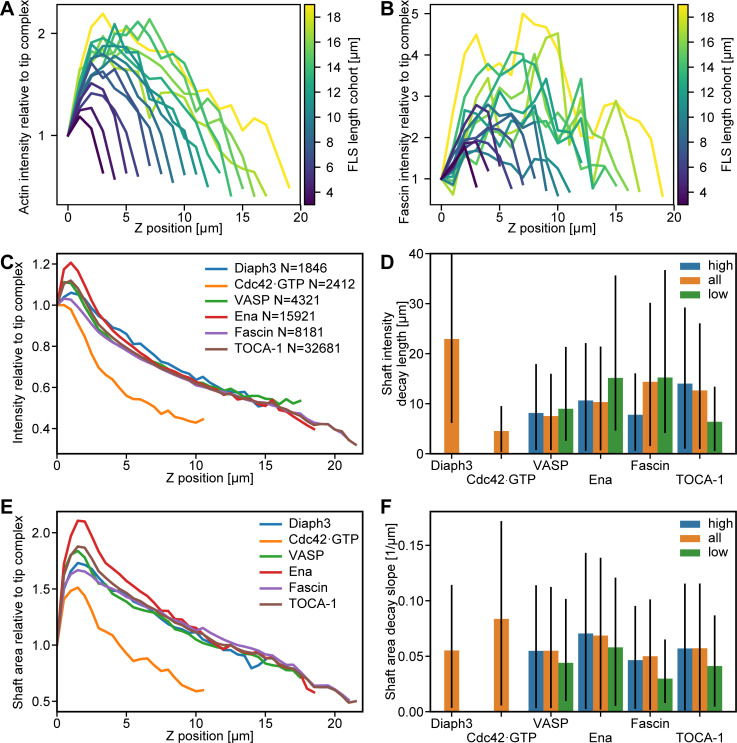
Figure S4.
The FLS shaft intensity is similar in all compositions. (A) Actin intensity along the shaft perpendicular to the x-y plane and relative to the intensity at the FLS tip complex for FLS cohorts (n = 1,818). The FLSs are categorized according to their lengths in 1-μm cohorts. (B) The same as in A for the fascin intensity along the shaft. (C) Median actin intensity along the shaft perpendicular to the x-y plane and relative to the intensity at the FLS tip complex from assays with the given proteins labeled (n numbers given in the legend). (D) Median actin intensity exponential decay length along the FLS shaft from fitting an exponential decay for a given protein enriched (high) or absent (low) compared with the whole set (all). Diaph3/all, n = 1,846; Cdc42·GTP/all, n = 2,312; VASP/all, n = 4,321; VASP/high, n = 1,297; VASP/low, n = 1,297; Ena/all, n = 15,921; Ena/high, n = 4,797; Ena/low, n = 4,793; Fascin/all, n = 8,181; Fascin/high, n = 2,463; Fascin/low, n = 2,461; TOCA-1/all, n = 32,581; TOCA-1/high, n = 9,813; and TOCA-1 low, n = 9,806. Error bars represent the 66% confidence interval obtained via resampled residuals bootstrap. Missing bars are due to fitting failures resulting from too small n numbers. (E) Median cross-sectional FLS area along the shaft from assays with different proteins labeled (n numbers given in C). (F) Median negative slope of actin width from linear decay fits for a given protein enriched (high, above 70th percentile) or absent (low, below 30th percentile) compared with the whole set (all). N numbers given for D. Error bars represent the 66% confidence interval obtained via resampled residuals bootstrap.

