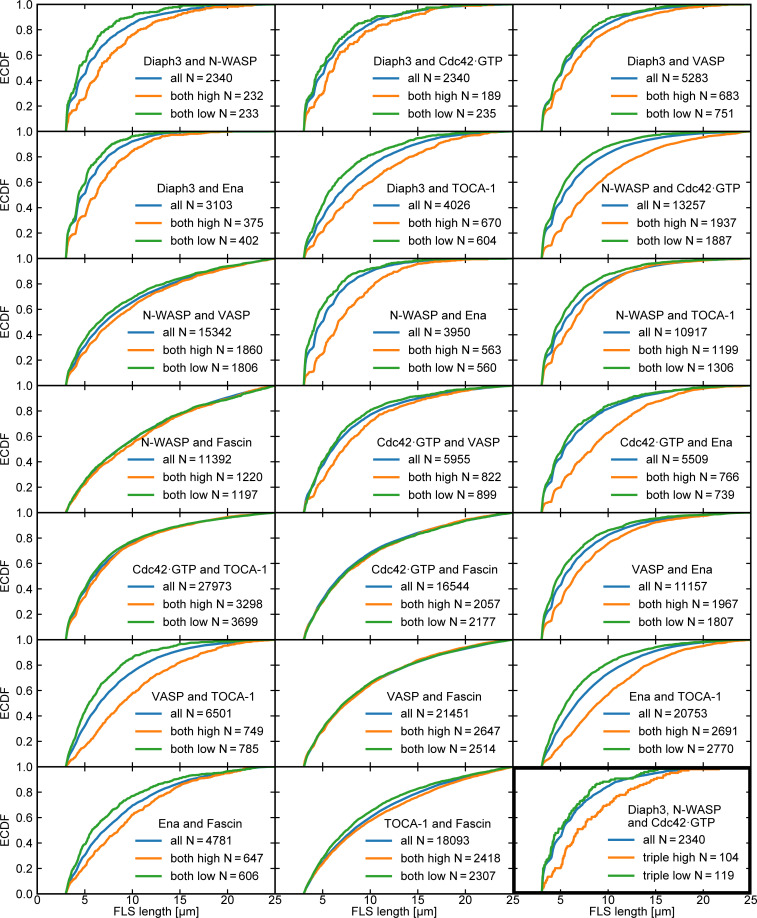
Figure S5.
FLS lengths for different double combinations of proteins. Cumulative frequency plots (empirical cumulative distribution function, ECDF) of FLS length for all double combinations of regulatory proteins for the specific cohort (blue lines), both proteins enriched above a 70% intensity threshold (orange lines), and both proteins below the enrichment threshold (green lines). N values are given in the panel legends. All combinations enriched in Diaph3 and Ena are longer, together with some others. FLSs enriched in Fascin are usually no longer than those without, except when TOCA-1 is also enriched (compare green and orange lines). The triple combination of Diaph3/N-WASP/Cdc42•GTP shows similar effects (bottom right, black outline). Overall, length arises from multiple small, interacting effects.

