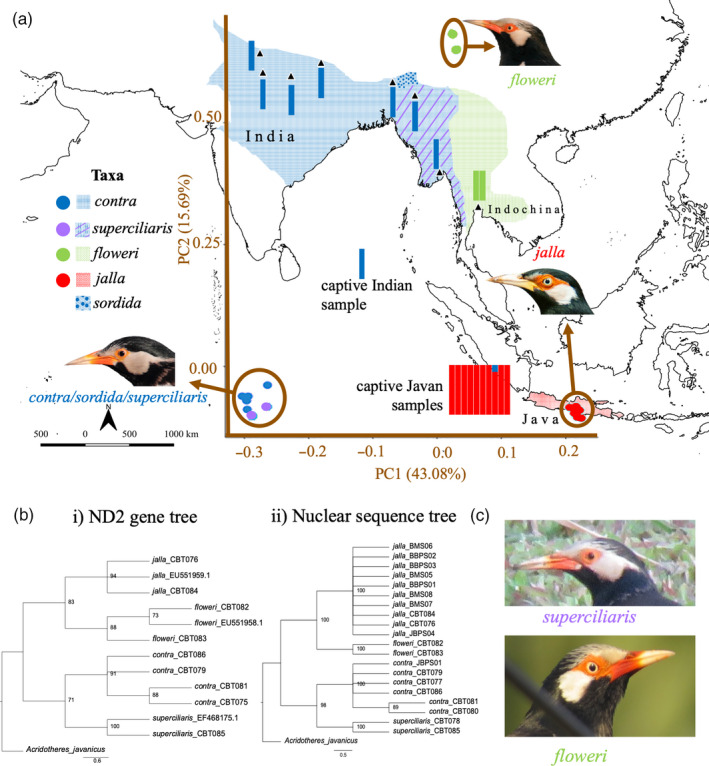
FIGURE 1.

(a) Map showing the Asian distribution, sampling localities, and population structure for the five taxa of the Asian Pied Starling (Gracupica contra) complex: nominate contra, sordida, superciliaris, floweri and jalla. Black triangles depict wild sampling localities. Principal component analysis (PCA) is superimposed on the map with brown axes and based on an unlinked variant set of 936 SNPs (SNP set A2). STRUCTURE results are displayed as colored columns adjacent to collection localities (one column per individual) and are based on 412 unlinked SNPs (SNP set B2) at K = 3, with each color representing a different ancestral contribution. Legend depicts the color of PCA points (circles) and of distribution ranges (squares) for each taxon. Coastline map sourced from Natural Earth (www.naturalearthdata.com). Bird photo credits: contra—Mustafa Sozen, floweri—Peter Ericsson, jalla—Boas Emmanuel. (b) Maximum‐likelihood consensus trees based on (i) mitochondrial ND2 gene with bootstrap support ≥70% shown beside nodes and (ii) concatenated nuclear sequences of 117 loci (each with >12 SNPs per locus) with bootstrap support ≥95% shown beside nodes. GenBank accession numbers or sample codes are given behind each taxon name. (c) Pictures of superciliaris and floweri demonstrating differences in eye color and extent of bare facial skin across the two taxa. Photo credits: superciliaris—Thomas Brooks, floweri—Tom Wheatley
