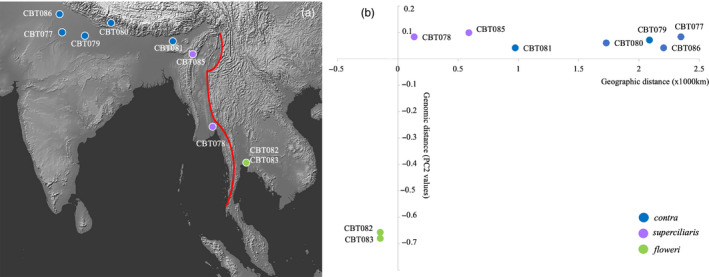
FIGURE 2.

(a) Terrain map of South and South‐East Asia. Each individual point marks a wild sample locality and the red line depicts the terrain boundary of the Thai–Burmese border mountain range, which separates taxa superciliaris (from Myanmar) and floweri (from Thailand). Terrain map sourced from Natural Earth (www.naturalearthdata.com); (b) Graph showing relationship between geographic and genomic distances. The x‐axis refers to the geographic distance of the collection localities of contra, superciliaris, and floweri to the nearest point along the terrain boundary (red line in panel a), with positive values reflecting points west of the terrain boundary and negative values east of the boundary. The y‐axis reflects genomic distance expressed in terms of PC2 values from the PCA plot based on SNP set B2 (Fig. S3b)
