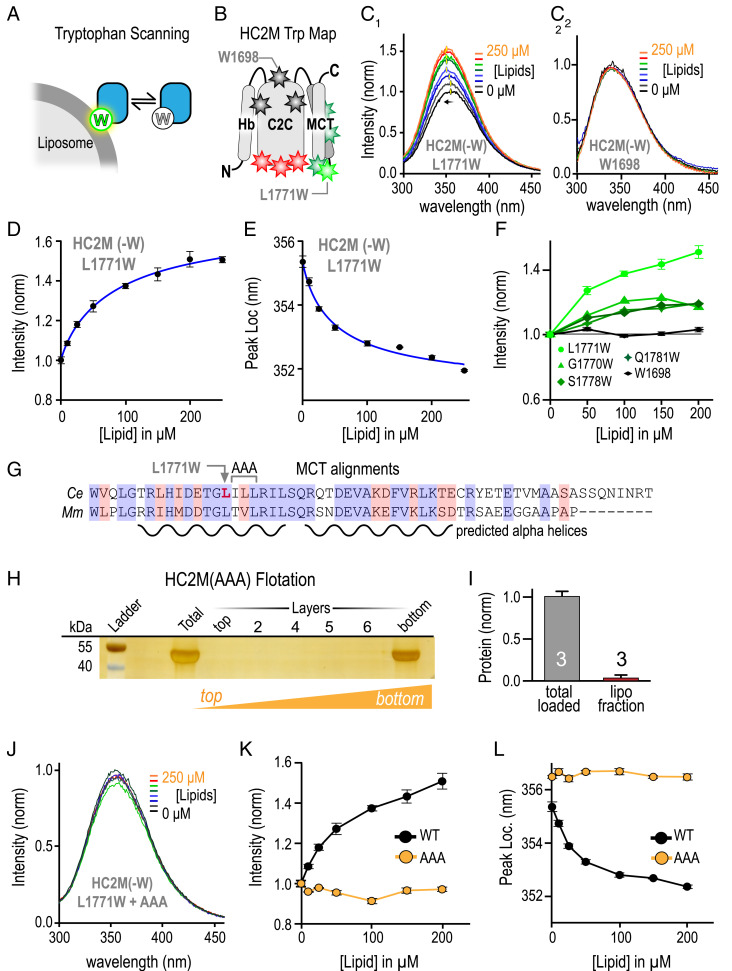
Fig. 4.
HC2M binds membranes via MCT. (A) Cartoon of Trp residue penetrating into the SUV membrane. (B) Cartoon of the HC2M domain depicting the placement of Trp (W) residues at various locations with color indicating response to liposomes (red = unfolded, black = no response, dark green = small response in peak intensity, and light green = large response in both peak amplitude and blue shift). HC2M(-W) is a variant of HC2M with all four endogenous Trp residues removed. Emission spectra for L1771W (C, 1) and W1698 (C, 2) for a series of liposome concentrations. The location (D) and normalized intensity (E) of the emission peak for L1771W versus lipid concentration with simple binding model fits (blue). (F) Trp emission intensity versus lipid concentration for Trp locations in MCT (green) along with W1698 in C2C (black). (G) Sequence alignment of the MCT domain for C. elegans (Ce) UNC-13 and mouse (Mm) Munc13-1 indicating the residues mutated to alanines (ILL to AAA) and the predicted helix content. (H) Liposome flotation for GST-HC2M (AAA) mutant. (I) Quantification of the liposome binding assay normalized for the total protein loaded with n = 3 independent replicates. (J) Trp emission spectra for HC2M(-W) + L1771W + AAA. The emission peak (K) and peak location (L) plotted versus lipid for WT (black) and AAA (orange) variants of L1771W. Error bars are mean ± SEM.

