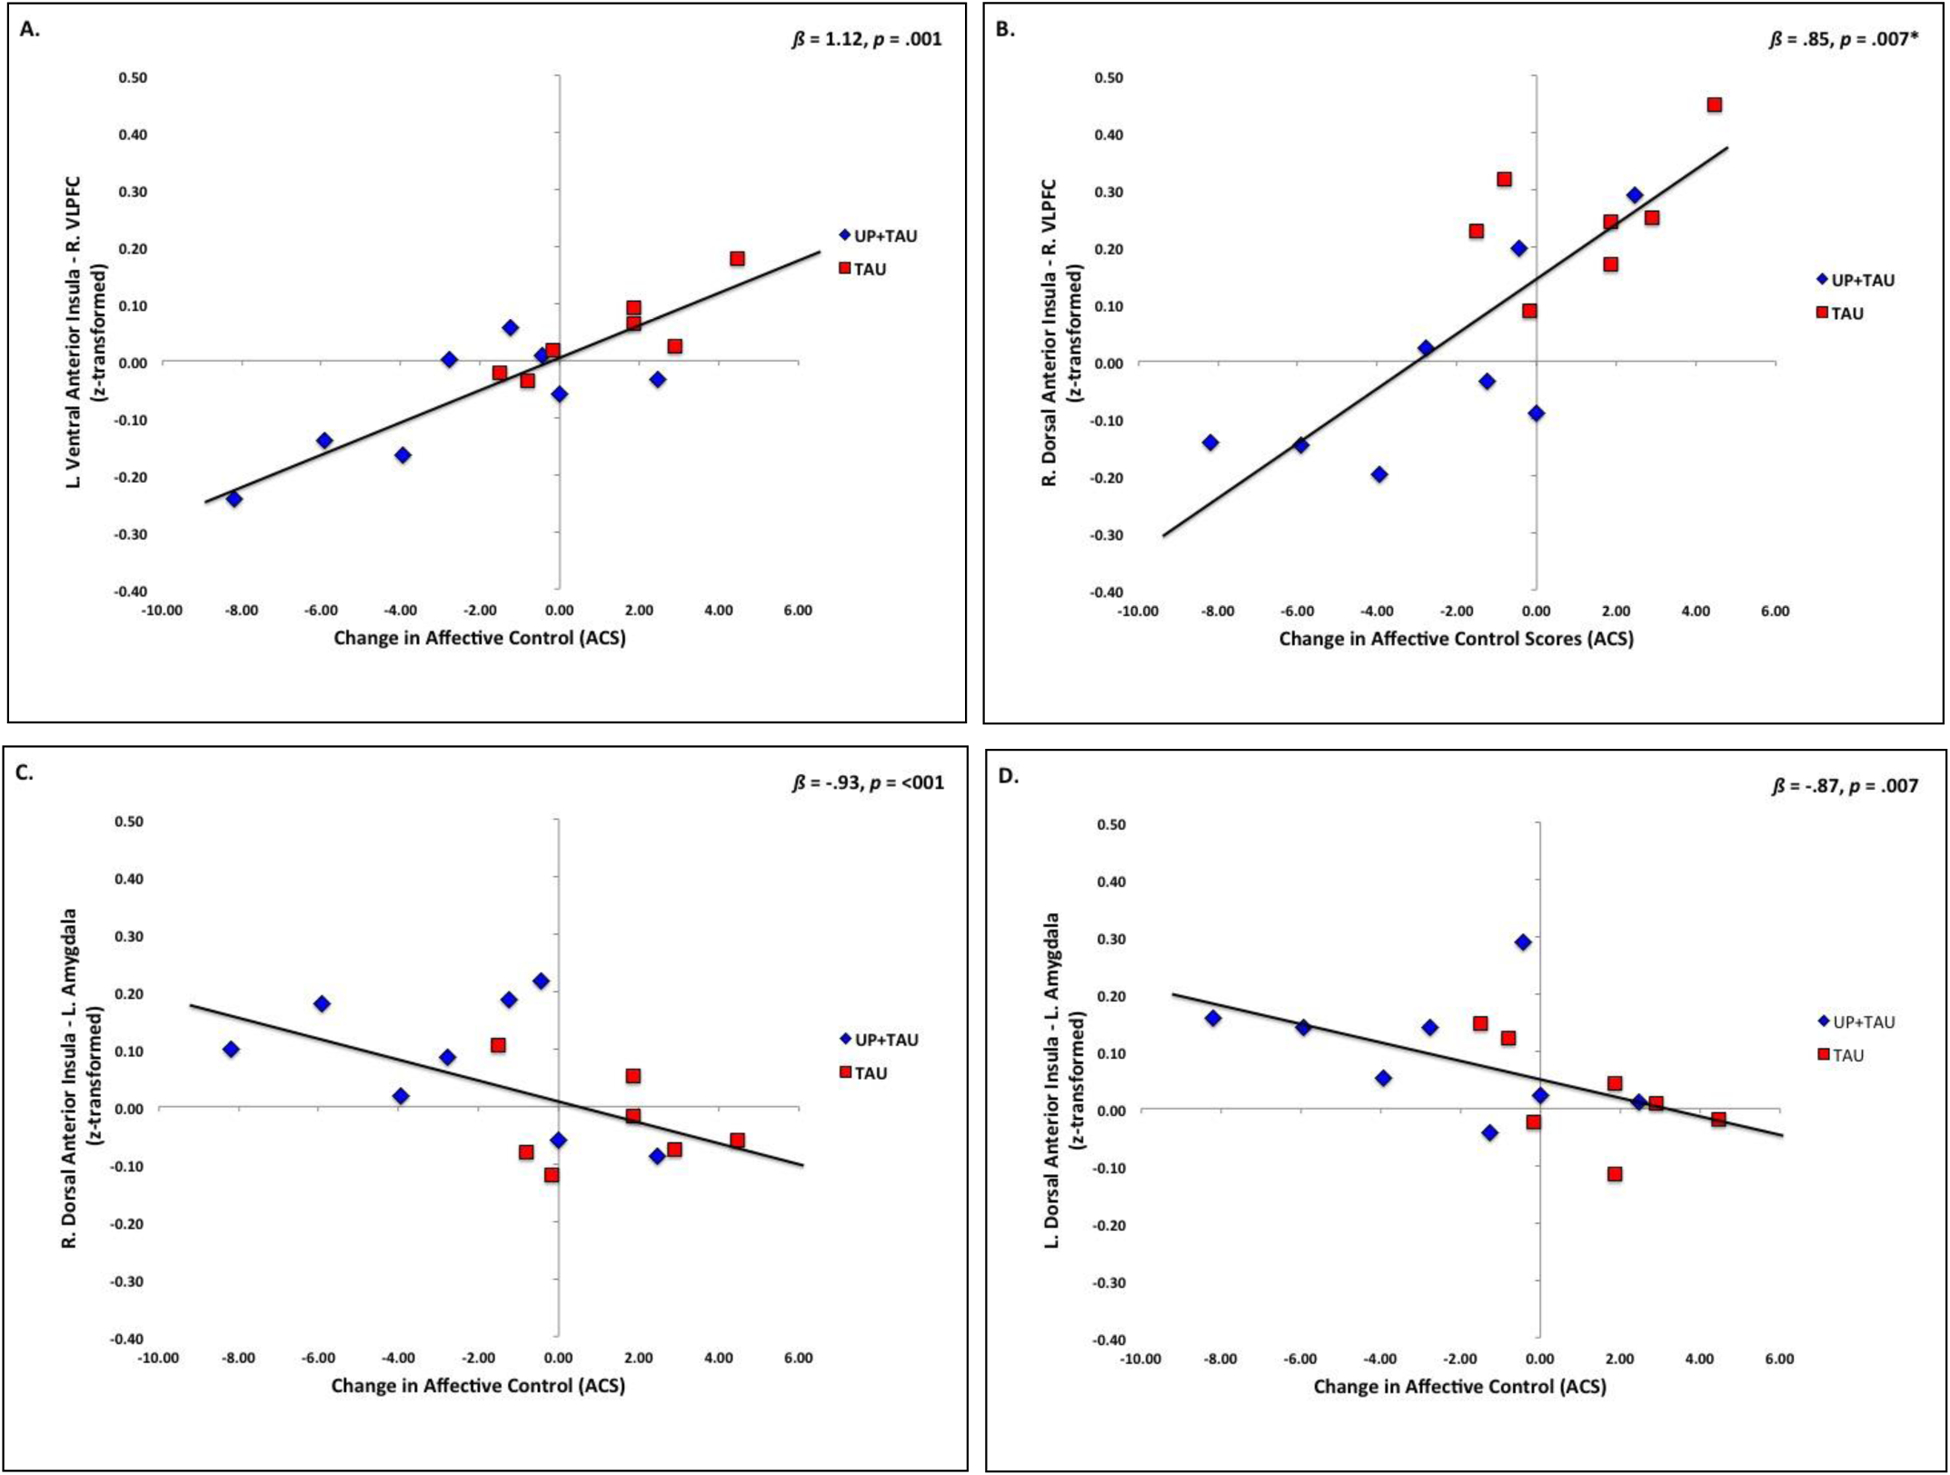
Figure 3.

Relationship (Pearson’s r) between slope of change (slope b) in perceived affective control (ACS scores) and baseline functional connectivity between A) left ventral anterior insula – right VLPFC; B) right dorsal anterior insula – right VLPFC; C) right dorsal anterior insula – left amygdala; and D) left dorsal anterior insula – left amygdala. Functional connectivity values reflect r-to-z-transformed scores. Change slope scores represent the slope of change in ACS scores over 6 monthly assessments. Negative change score values represent linear reductions in ACS scores over time. Higher ACS scores reflect greater deficits in perceived affective control. Displayed ß and p-values represent results of linear regression models controlling for age, gender, and medication load. *Result shown is uncorrected; did not survive corrections for multiple comparisons.
