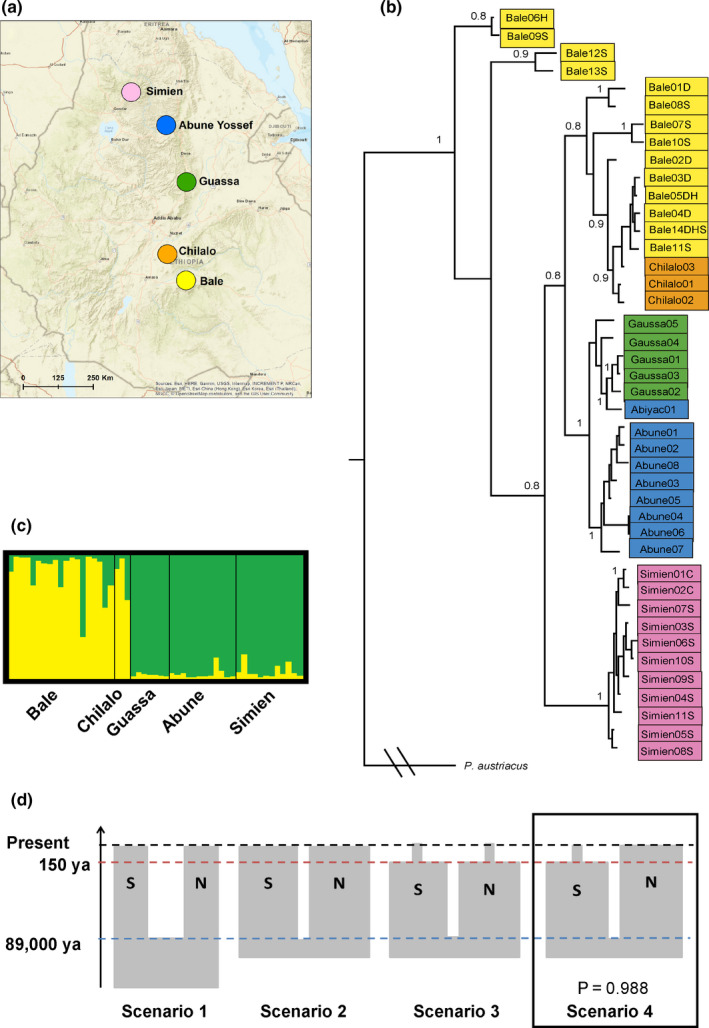
Figure 2.

Plecotus balensis genetic population structure: (a) colour‐coded mountain ranges sampled in the study; (b) Bayesian phylogenetic tree based on the combined cytb and HVI mtDNA regions, with Plecotus austriacus as an outgroup and showing branch support > 0.8; (c) results of the STRUCTURE analysis dividing the microsatellite dataset into two population clusters, south (yellow) and north (green) of the Rift Valley; and (d) the best‐supported scenario in the approximate Bayesian computation analysis of demographic history (scenario 4), with width of boxes reflecting relative population sizes, S and N denoting south and north of Rift Valley populations, blue dashed line for population split time, red for recent population decline and black for the present time
