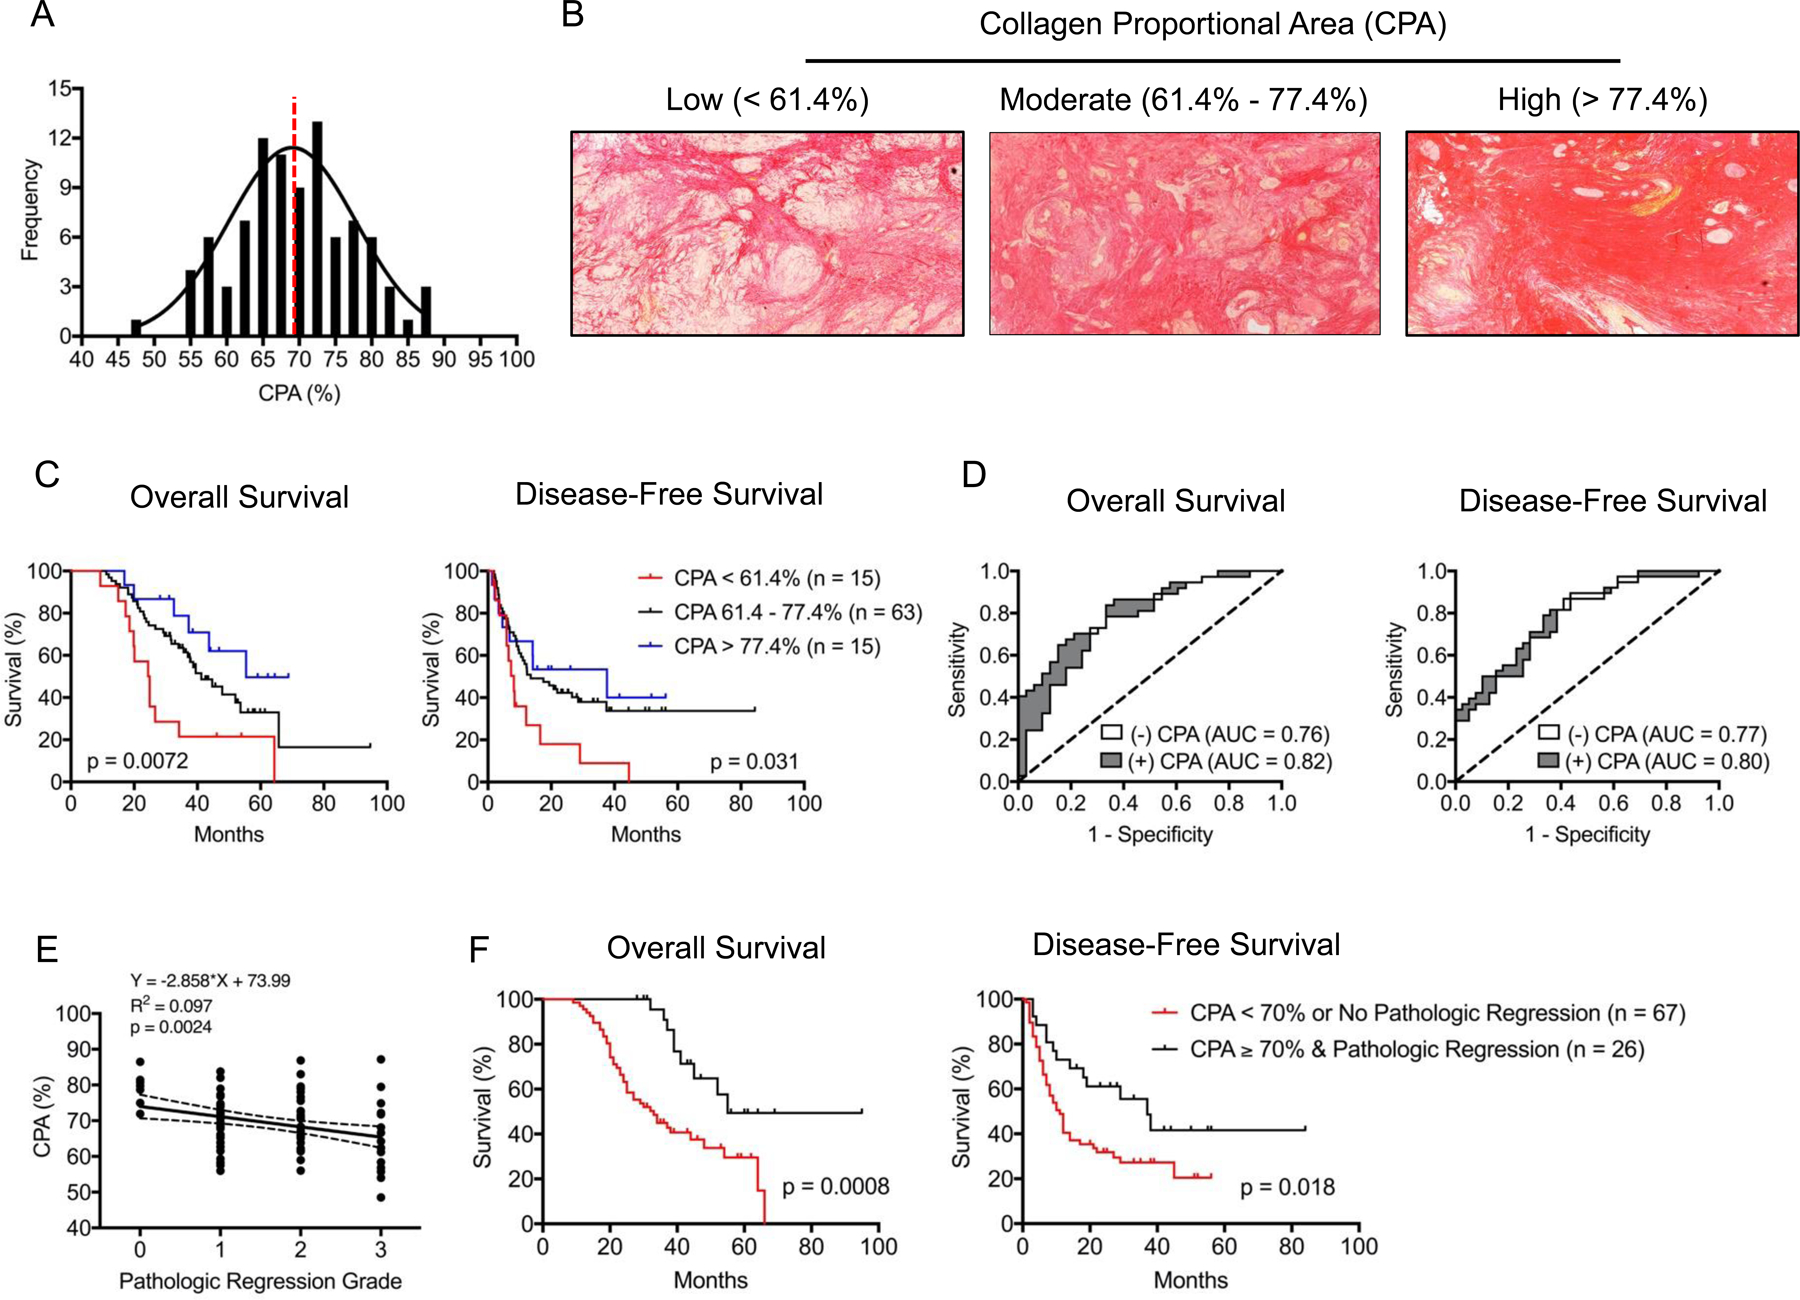
Figure 1:

(A) Frequency distribution plot for tumor fibrosis levels measured by digital quantification of Sirius Red collagen staining. Dashed red line separates patients by CPA < 70% or ≥ 70%. (B) Sirius Red collagen staining of tumor samples representing low (CPA < 61.4%), moderate (61.4% −77.4%), and high (CPA > 77.4%) fibrosis groups. Residual cancer cells occupy regions of non-fibrotic tissue. Kaplan-Meier survival curves based on (C) CPA stratified into low (CPA < 61.4%, red), moderate (61.4% −77.4%, black), and high (CPA > 77.4%, blue) fibrosis groups. (D) Logistic regression model for prediction of median OS and DFS including (gray) and excluding (white) CPA as a variable. (E) Correlation between CPA (%) and pathologic regression grading (tumor regression grades: 0 = complete response, no viable tumor cells; 1 = moderate response, single small cells or groups of cells; 2 = minimal response, residual cancer outgrown by fibrosis; 3 = poor response, minimal or no tumor kill, extensive residual cancer. (F) Kaplan-Meier survival curves for OS and DFS stratified by CPA < 70 & no pathologic response (regression grade 2 – 3) (red) compared to CPA ≥ 70% & pathologic response (regression grade 0 – 1) (black).
