
Figure 2:
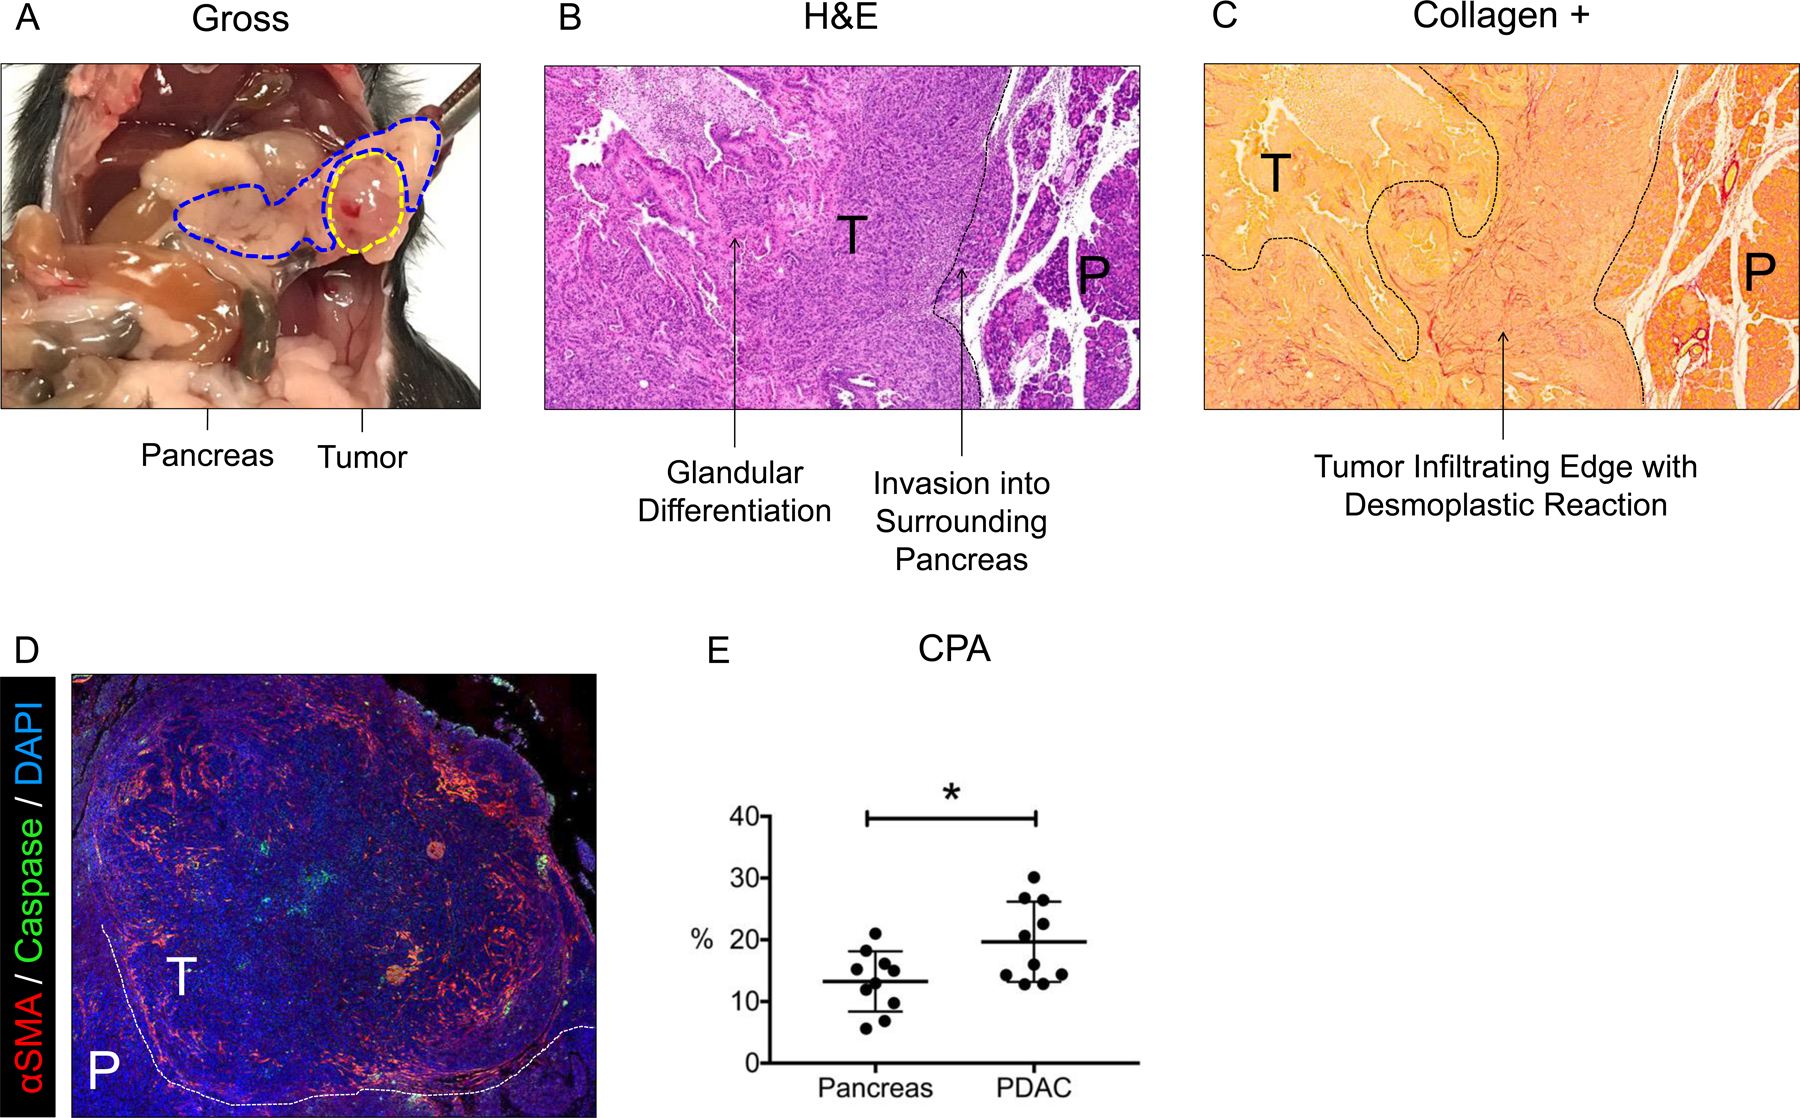
(A) Gross image of pancreas (blue dotted line) and PDAC tumor (yellow dotted line) 14 days after orthotopic injection. (B) Hematoxylin and eosin (H&E) staining of the tumor and surrounding pancreas. Histologic features are labeled with arrows. (C) Sirius Red staining of the tumor and surrounding pancreas. Desmoplastic reaction at the tumor’s infiltrating edge is indicated by intense red stain (increased collagen density). (D) Immunofluorescent staining of αSMA in tumor and surrounding pancreas. (E) Collagen proportional area (CPA) of tumor and surrounding pancreatic tissue. T = tumor; P = pancreas. * p < 0.05; ** p < 0.01.