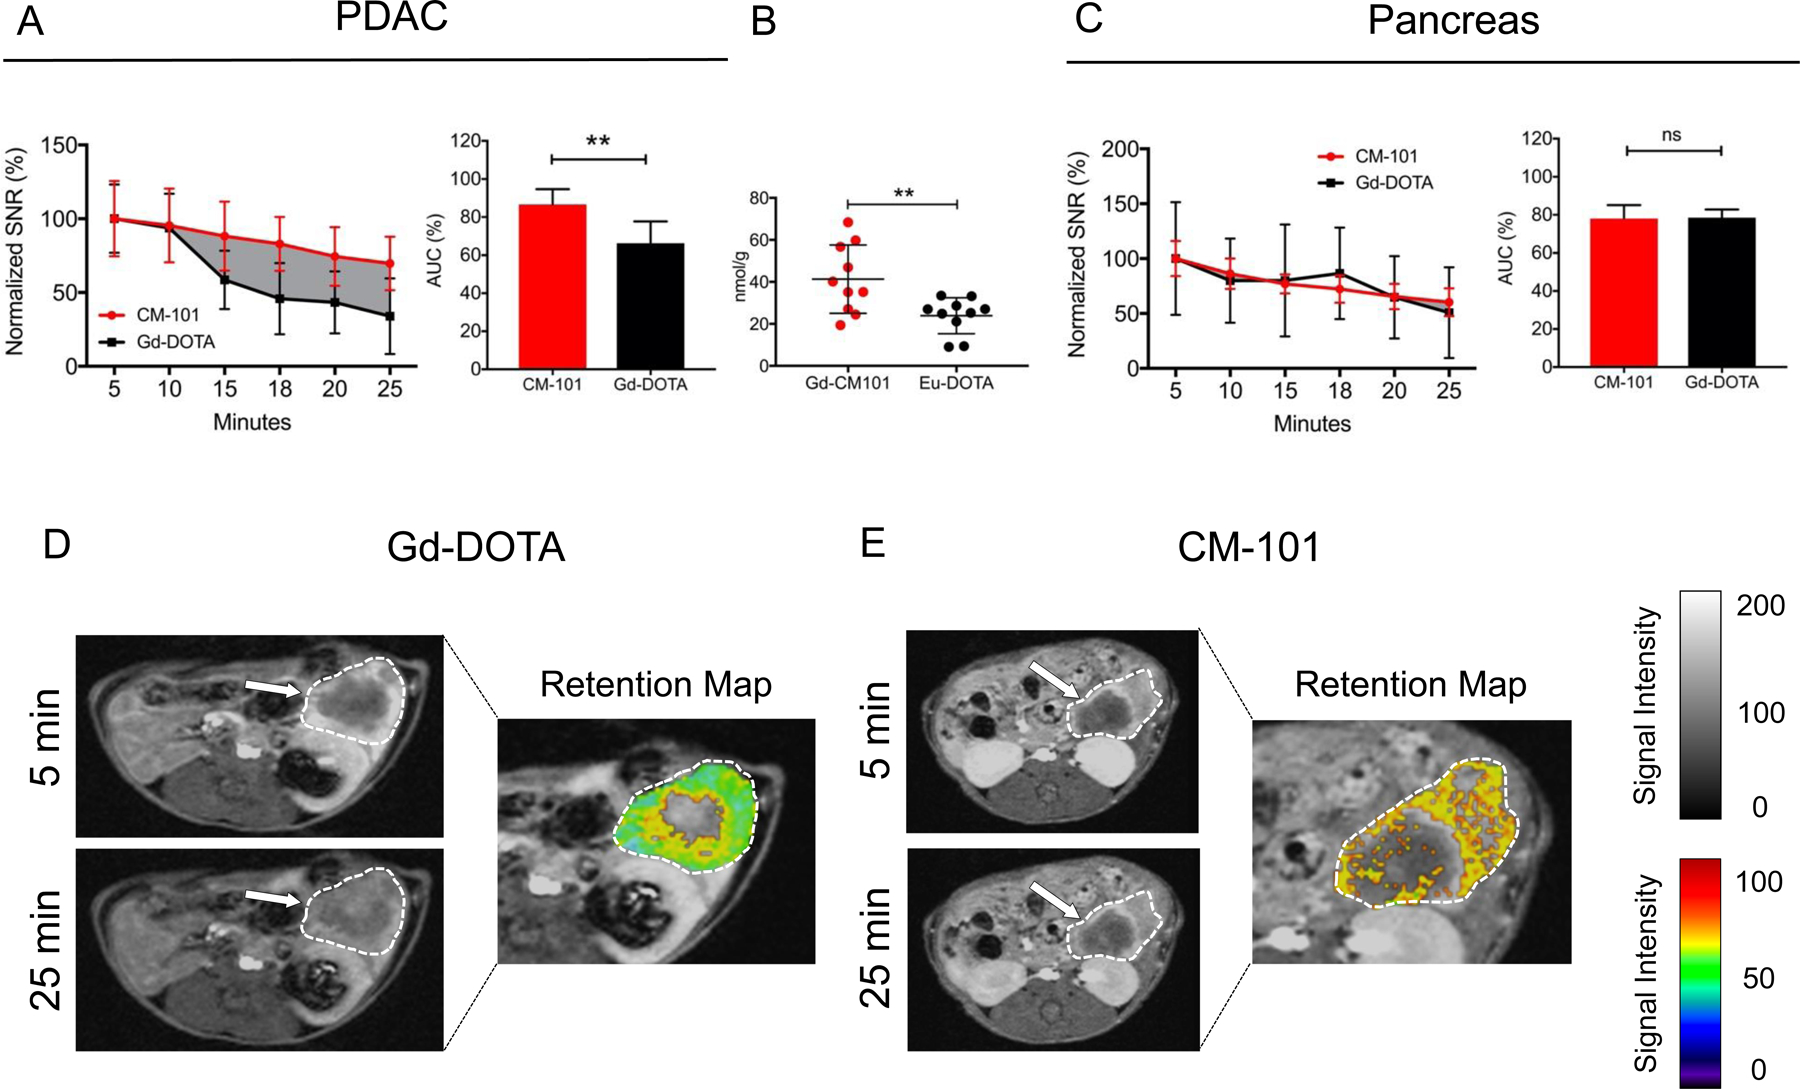
Figure 4:

(A) SNR measurements are normalized to peak intensity at 5 minutes. Plotted lines represent Gd-DOTA (black) and CM-101 (red) signal loss over 25 minutes. Relative to peak signal, the MR signal intensity is significantly greater with CM-101 compared to Gd-DOTA from 15–25 minutes. Difference in AUC5–25 is graphically displayed by solid gray background. AUC5–25 for the Gd-DOTA and CM-101 are shown in the bar graph. (B) ICP-MS quantitation of Eu-DOTA and CM-101 probes in PDAC tissue 25 minutes after tail vein injection. (C) Relative MR signal loss in surrounding pancreatic tissue 5–25 minutes post injection with CM-101 and Gd-DOTA. AUC5–25 for Gd-DOTA and CM-101 are shown in the bar graph. (D) Representative axial images of untreated PDAC 5 and 25 minutes after Gd-DOTA injection. Tumor is outlined in white (grayscale) and white arrows point to fibrotic tumor regions. Retention map displays MR signal intensity normalized to peak signal at 5 minutes in tumor tissue. (E) Representative axial images of untreated PDAC 5 and 25 minutes after CM-101 injection with retention map. * p < 0.05; ** p < 0.01.
