Fig. 5.
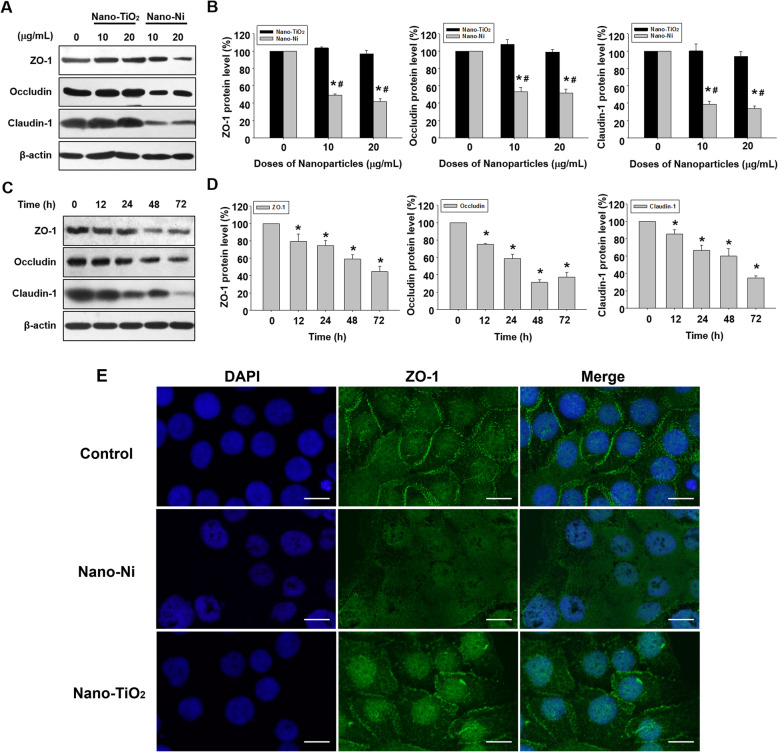
Dose- and time-dependent reduction of tight junction-associated proteins in HaCaT cells exposed to Nano-Ni. a-d Expression of tight junction-associated proteins in HaCaT cells were determined by Western blot after cells were exposed to 10 or 20 μg/mL of Nano-Ni or Nano-TiO2 for 24 h (a & b), or to 20 μg/mL of Nano-Ni for 12, 24, 48, or 72 h (c & d). Cells without treatment were used as control. a and c are the results of a single experiment, while b and d are normalized band densitometry readings averaged from three independent experiments ± SE. * Significant difference as compared with the control group, p < 0.05; # Significant difference as compared with the same dose of Nano-TiO2-treated group, p < 0.05. e Downregulation of ZO-1 (green staining) in HaCaT cells exposed to 20 μg/mL of Nano-Ni for 24 h by immunofluorescent staining. DAPI (blue) stains the whole nucleus of a cell. Scale bar represents 20 μm for all panels

