Fig. 1.
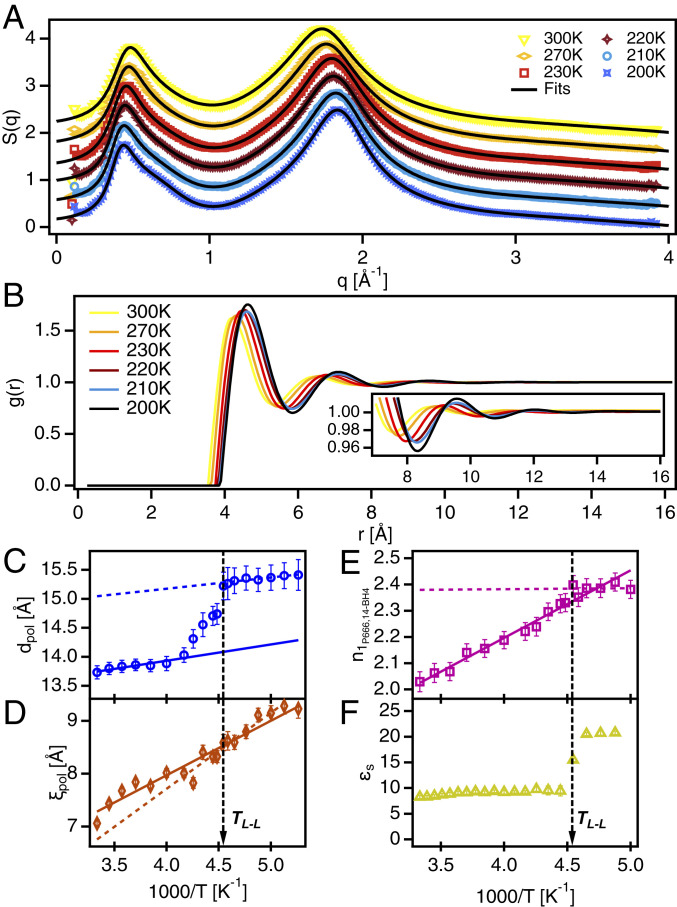
Reorganization of mesoscopic structure in []+[BH4]−. (A) X-ray scattering intensity, S(q), at various temperatures, offset in the y axis for clarity. Solid black lines represent fits to the data using two Teubner–Strey equations below q = 1 and three Lorentz functions above q = 1. (B) Radial distribution function, g(r), calculated from fits to S(q). (B, Inset) Detail of g(r) between 7 and 16 Å−1. (C) Periodicity, d, of the polarity alternation structure, i.e. first sharp diffraction peak. (D) Correlation length, , of the polarity alternation structure. (E) Coordination number from the first shell based on integrated area of the first peak in g(r). (F) Static dielectric permittivity measured using BDS. Solid and dotted lines in C–E represent linear fits to the data to serve as guides for the eye. Vertical dashed black lines indicate the LLT temperature.

