Fig. 1.
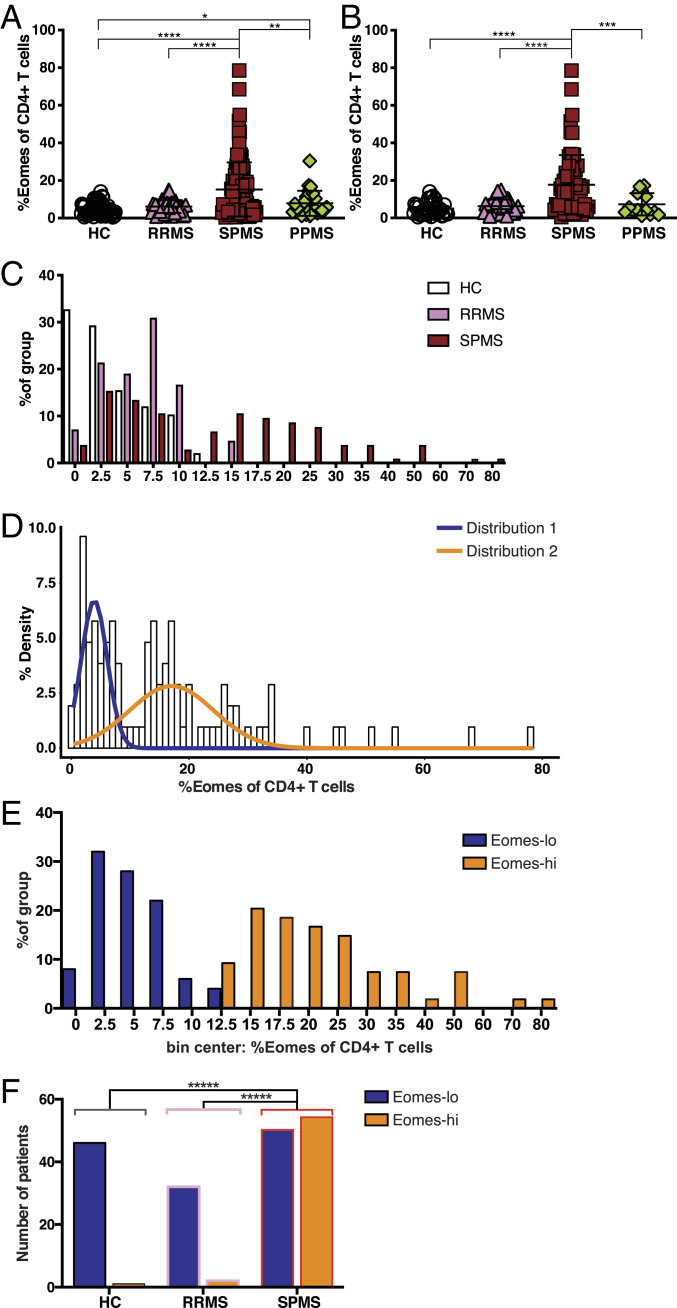
High proportions of Eomes+ Th cells are associated with SPMS. (A) Proportion of Eomes+ cells among CD4+ Th cells. Data from all the samples are shown. *P < 0.05, **P < 0.01, ****P < 0.0001, based on one-tailed Mann–Whitney U test. (B) Proportion of Eomes+ cells among CD4+ Th cells. When data were obtained at multiple times, only data from the first samples are included here. ***P < 0.001, ****P < 0.0001, based on one-tailed Mann–Whitney U test. (C) Distribution of HC, RRMS, and SPMS samples split into bins, based on % of Eomes+ cells among CD4+ T cells. (D) Histogram of Gaussian mixture modeling of Eomes+ Th cells in SPMS patients according to a binomial distribution. (E) Distribution of the Eomes proportion (Eomes+ cells among CD4+ Th cells) for SPMS patients split into Eomes-lo (<13%) and Eomes-hi (≥13%). (F) Histogram for number of subjects in each patient/control group split by Eomes-hi/Eomes-lo status based on a 13% cutoff. ****P < 0.0001, two-tailed χ2 test with Yates’ correction. SPMS versus RRMS OR = 17.28; SPMS versus HC OR = 49.68; HC Eomes-lo (n = 46), HC Eomes-hi (n = 1); RRMS Eomes-lo (n = 32), RRMS Eomes-hi (n = 2); and SPMS Eomes-lo (n = 50), SPMS Eomes-hi (n = 54).

