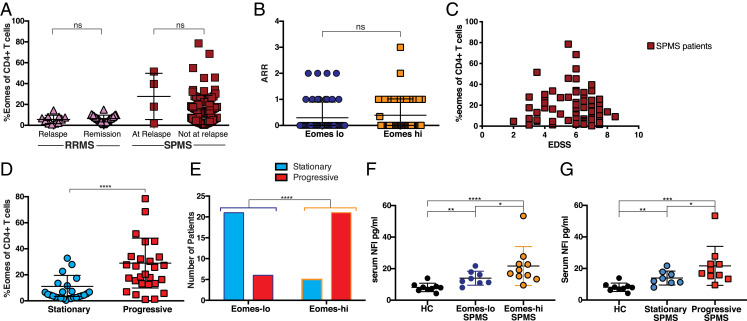
Fig. 2.
Relationship between Eomes+ Th cell proportions and current disease status. (A) Current relapse versus nonrelapse at sampling time. Shown are percentages of Eomes-expressing cells among the CD4+CD3+ PBMC for RRMS or SPMS patients at relapse or nonrelapse state. Not significant (ns) (P = 0.234), two-tailed Mann–Whitney U test; RRMS at relapse (n = 11); RRMS during remission (n = 30); SPMS at relapse (n = 4); and SPMS at nonrelapse state (n = 100). (B) ARR for individual samples from SPMS patients with Eomes-lo and Eomes-hi status. ns (P = 0.232), two-tailed Mann–Whitney U test; and Eomes-lo (n = 50), Eomes-hi (n = 54). (C) EDSS and proportions of Eomes+ Th cells among CD4+ Th cells in individual SPMS patients. Spearman correlation r = −0.07 and P = 0.50. (D) Proportion of Eomes+ Th cells among CD4+ T cells from SPMS patients (Table 2). After exclusion of patients with an initial EDSS of seven or higher before sampling, the samples were categorized as being from progressive or stationary status based on clinical assessment after sampling, which was validated by EDSS ****P < 0.0001 Mann–Whitney U test. (E) Proportion of SPMS patients in SI Appendix, Table S1 grouped by Eomes-lo or -hi based on a 13% cutoff with progressive status ****P < 0.0001 χ2 test, OR = 15.2; and Eomes-lo (n = 27), Eomes-hi (n = 31). (F) Serum levels of NFl. Comparison of HC, Eomes-lo SPMS, and Eomes-hi SPMS. *P < 0.05, **P < 0.01, ****P < 0.0001. (G) Serum levels of NFl. Comparison of HC, SPMS at stationary phase (stationary SPMS), and SPMS at progressive phase (progressive SPMS). *P < 0.05, **P < 0.01, ***P < 0.001.

