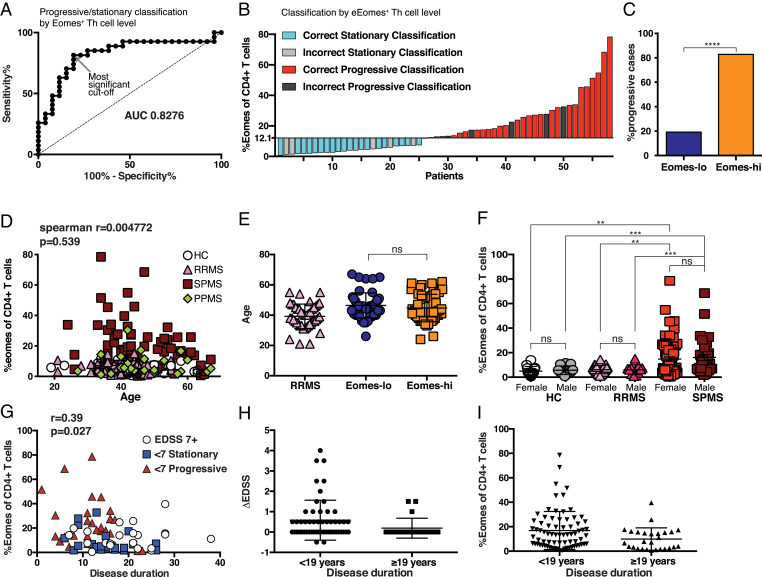
Fig. 3.
Eomes-hi as a biomarker for SPMS patients in a progressive state. (A) ROC plot of progressive/stationary prediction by sensitivity versus 1-specficity for Log2 transformed %Eomes+ of Th cells for SPMS patients (SI Appendix, Table S1); the gray arrow shows most significant cutoff value at Eomes = 12.1. (B) Waterfall plot of predictive classification of progressive/stationary status in SPMS patients using cutoff Log2-Eomes = 3.683 (Eomes = 12.83). (C) Proportion of progressive cases among Eomes-lo and Eomes-hi populations based on a cutoff of 12.1%. ****P < 0.0001, Fisher’s exact test, OR = 21.8 (Eomes-hi n = 31, Eomes-lo n = 26). Percentage of Eomes-expressing cells among the CD4+CD3+ was calculated for individual samples in each patient group as listed in Table 1. (D) The subjects’ ages were compared with Eomes+ proportions for correlation (Spearman correlation r=−0.0037 and P = 0.65) and (E) compared between SPMS patients with the Eomes proportion below 13% (Eomes-lo) or above 13% (Eomes-hi). (F) Percentage of Eomes-expressing cells among the CD4+CD3+ for each patient group split into male and female subjects (**P < 0.001, ***P < 0.0001, ns two-tailed Mann–Whitney U test). (G) Eomes+ cell proportion among CD4+CD3+ T cells corresponding to disease duration of SPMS patients. Data are grouped by the EDSS level into SPMS “Stationary below EDSS 7” (<7 Stationary), SPMS “Progressive below EDSS 7” (<7 Progressive), or SPMS with “EDSS of 7 or above” (EDSS 7+). (H) Eomes proportion among Th cells for SPMS patients split by disease duration (over 19 y history, n = 55 or under 19 y history, n = 21); P = 0.0180 Mann–Whitney U test. (I) The change in EDSS over 1 y (Δ-EDSS) for SPMS patients split by disease duration (over 19 y history, n = 55 or under 19 y history, n = 21); P = 0.0294 Mann–Whitney U test.

