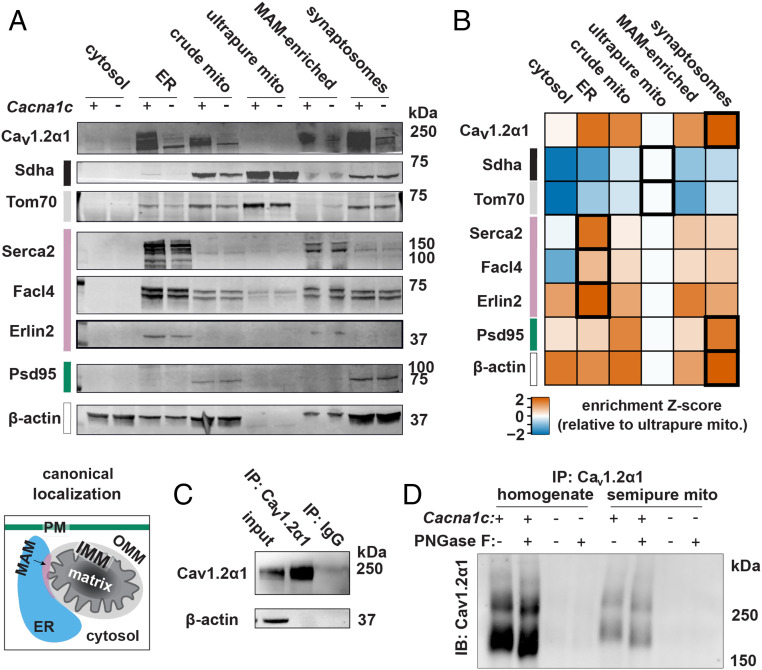
Fig. 2.
Cav1.2α1 in crude mitochondria is an artifact of Cav1.2α1 in the ER. (A) Representative immunoblots of brain mitochondria ultrapurification show depletion of Cav1.2α1 and MAM immunoreactivity from ultrapure mitochondria. Subcellular compartments are color coded as cytosol (white), PM (teal), ER (blue), MAM (pink), OMM (light gray), IMM (black), and mitochondrial matrix (dark gray) (n = 4, combined from three experiments). (B) Z score of marker enrichment relative levels in ultrapure mitochondria fraction during mitochondria ultrapurification. Highest enrichment fractions are boldly outlined. (C) Immunoprecipitation of Cav1.2α1 enriches Cav1.2α1 relative to IP input (Upper). (D) Representative immunoblots show bands from PNGase F treatment following Cav1.2α1 antibody immunoprecipitation from whole-cell homogenates and semipure mitochondria to evaluate for the presence of N-glycosylation protein modifications (n = 4, combined from two experiments).

