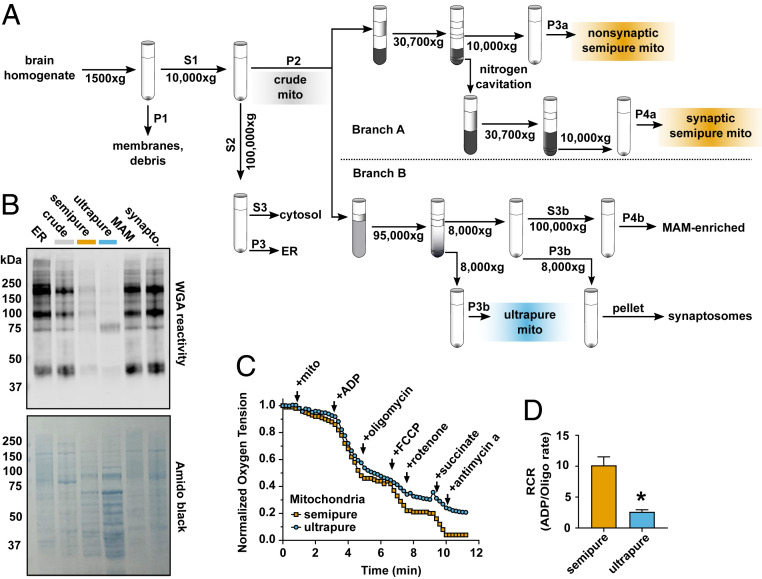
Fig. 4.
Brain mitochondria ultrapurification removes ER contaminants but impairs function. (A) Schematic workflow for the dual-process brain mitochondria isolation protocol shows that after isolation of crude mitochondria (gray), branch A yields semipure mitochondria (orange) over a discontinuous Percoll gradient, and branch B yields ultrapure mitochondria (blue) over a self-forming continuous Percoll gradient. (B) Wheat germ agglutin (WGA) identification of N-glycosylated proteins in cellular subfractions shows that ER, crude mitochondria, semipure mitochondria, MAM, and synaptosomal brain cellular fractions are heavily glycosylated, while ultrapure brain mitochondria are relatively depleted of WGA immunoreactivity. Total protein quantification was visualized with amido black (n = 4 to 8, males and females, combined from three experiments). (C) Representative oxygen consumption trace from semipure brain mitochondria and ultrapure brain mitochondria. The change in oxygen saturation after manipulation of mitochondrial respiration was measured. (D) Brain mitochondrial RCR (ADP-stimulated/oligomycin-inhibited rates) shows that semipure brain mitochondria retained expected oxygen consumption, which is relatively depleted in ultrapure brain mitochondria (n = 4 to 8, males and females, combined from two experiments). *P = 0.01 by unpaired two-tailed Welch’s t test for unequal variances, Cohen’s d = 3.7.

