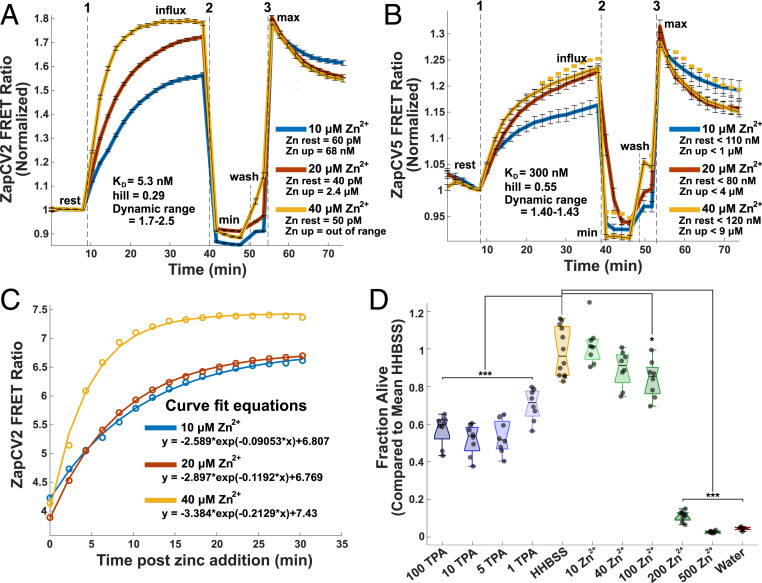
Fig. 1.
Characterization of Zn2+ perturbations. Quantification of cytosolic Zn2+ influx from extracellular addition in HeLa cells using (A) ZapCV2 and (B) ZapCV5. The FRET ratio of each trace was normalized by dividing by the FRET ratio at the frame immediately prior to Zn2+ addition. Dotted lines indicate media manipulation as follows: 1) addition of 10, 20, or 40 μM ZnCl2; 2) addition of 50 μM TPA (minimum); or 3) addition of 81.6 μM buffered Zn2+ + 0.002% saponin + 750 nM pyrithione (maximum). Traces are representative of three experiments on different days with n ≥ 20 cells per trace. Curve fits (C) were used to estimate maximum for calculations of the ZapCV2 (C) and ZapCV5 data. Fit parameters are in SI Appendix, Table S1. Cell death (D) was measured using CellTiter-Glo. Cells were incubated for 4 h in HHBSS with added micrometer concentrations of Zn2+ or TPA. Each point represents an individual well from a single experiment. Box plot shows the median, and whiskers represent 25th and 75th percentiles. One-way ANOVA results for deviation from HHBSS control represented by *P < 0.05, **P < 0.005, ***P < 0.0005.

