Fig. 2.
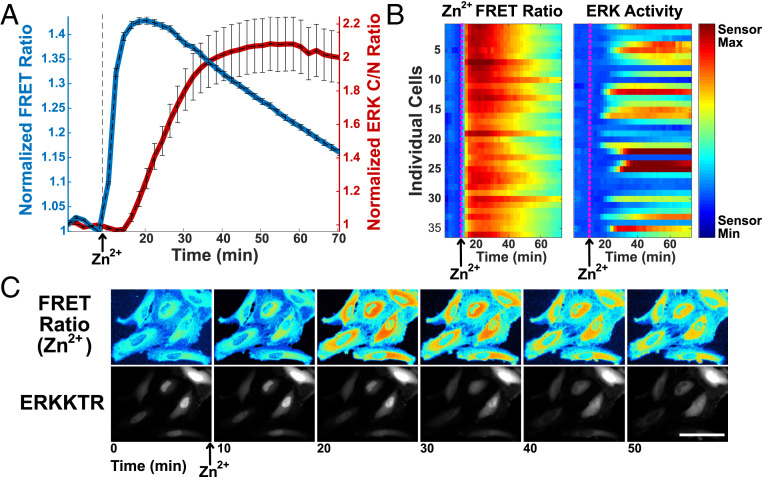
Simultaneous imaging of Zn2+ and ERK activity demonstrates that in individual HeLa cells, Zn2+ increase precedes the increase in ERK activity. (A) Normalized mean fluorescence signal (FRET ratio for ZapCV2 [blue] and C/N intensity ratio for ERKKTR [red]) and SD from 28 cells plotted against time. Fluorescence signal is normalized to the frame before Zn2+ addition. (B) Heatmap of individual cells compares the magnitude of Zn2+ increase and ERK activation side by side as a function of time. (Scale bar, 0.9 to 1.5 for Zn2+ FRET ratio; scale bar, 0.4 to 3.5 for ERK activity). (C) Snapshot images over the course of the experiment showing the pseudocolor FRET ratio image (ZapCV2 Zn2+ sensor) and mCherry fluorescence image (ERK translocation reporter movement from the nucleus to cytosol). (Scale bar, 100 μm.) Time-course videos are available as Movie S1 (ERKKTR) and Movie S2 (NES-ZapCV2 FRET).

