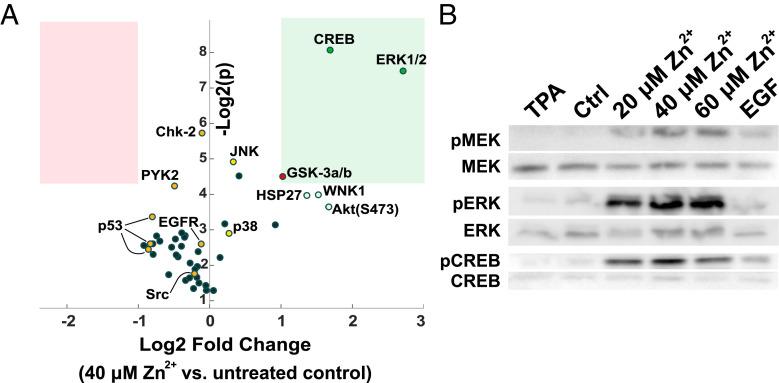
Fig. 3.
Kinase activation upon Zn2+ addition. (A) Log2 fold change in phosphorylation versus Log2 (P) for a series of human kinases upon Zn2+ treatment of HeLa cells. A Proteome Profiler Human Phospho-Kinase Array was used to evaluate changes in phosphorylation for a panel of kinases from cells either untreated or treated with 40 μM Zn2+ for 30 min. Two biological replicates were run per condition. The pink box represents Log2 fold change < −1 and P < 0.05. The green box represents Log2 fold change > 1 and P < 0.05. Details are in SI Appendix, Table S2. (B) Western blots for total and phosphorylated protein of MEK, ERK, and CREB show activation after treatment with different concentrations of Zn2+ for 30 min. Individual antibody blots were run on separate gels, cut at ∼48 kDa to compare with β-actin loading control (Fig. S4), and contrast was adjusted individually using ImageJ. Blots are representative of at least four separate experiments.

