Fig. 4.
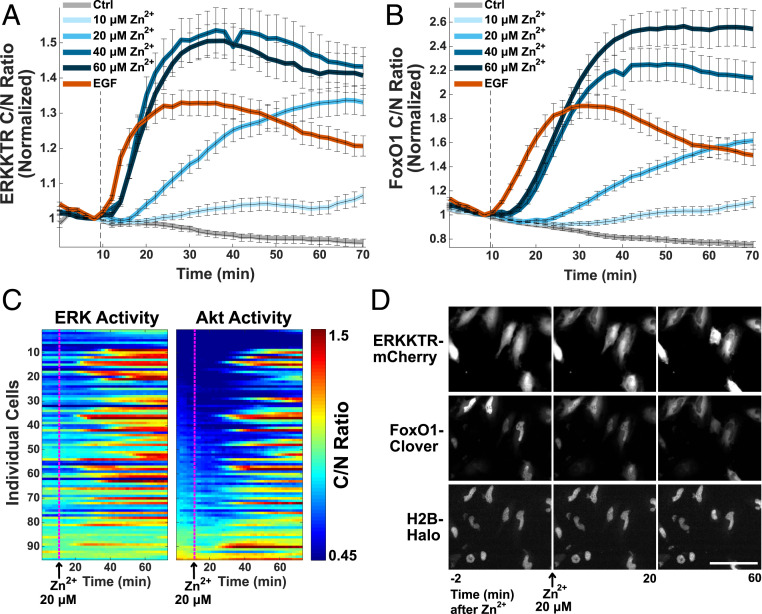
Zn2+ activates both ERK and Akt in a concentration-dependent manner. Averaged ERK activity (A) and corresponding averaged Akt activity (B) when indicated Zn2+ concentration or 20 nM EGF is added to HeLa cells at the dotted line. Both sensors were expressed in the same cell population and are represented by the mean cytosol/nuclear intensity ratio and SD error bars from at least 50 cells plotted against time, normalized to the frame before Zn2+ addition. (C) Representative heat map of non-normalized ERK and Akt activity in cells treated with 20 μM Zn2+ at 10 min. (Heat map scale bar, ratio: 0.45 to 1.5.) (D) Snapshot images over the course of the experiment showing the ERK (ERK-KTR-mCherry) and Akt (FoxO1-Clover) translocation sensors and nuclear marker H2B-Halo upon treatment with 20 μM Zn2+. (Image scale bar, 100 μM.) Time-course videos are available as Movie S3 (ERKKTR-mCherry) and Movie S4 (FoxO1-Clover).

