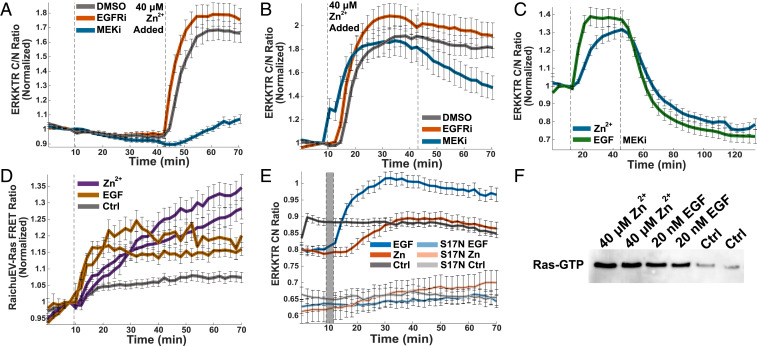
Fig. 6.
Kinases upstream of ERK are activated by Zn2+. MEK inhibition (1 μM CI-1040) either before (A) or after (B) Zn2+ addition reduces ERK activation, whereas EGFR inhibition (1 μM Gefitinib) does not. Dotted lines indicate addition of drug or Zn2+. Normalized mean and SD of at least 35 HeLa cells are plotted against time. Traces are representative of at least three separate experiments. (C) HeLa cells stimulated by Zn2+ and EGF (first dotted line) exhibit similar rates of ERK decay upon MEK inhibition (second dotted line). Normalized mean and SD of at least 38 cells are plotted against time. Traces are representative of three separate experiments. (D) Ras is activated by both Zn2+ and EGF when indicated Zn2+ concentration or 20 nM EGF is added to HeLa cells at the dotted line, measured via RaichuEV-Ras FRET sensor (Kazuhiro Aoki). The normalized mean and SD from at least 30 cells are plotted against time. Traces are representative of three out of four separate biological replicates. (E) Dominant negative Ras (S17N) blocks both Zn2+ and EGF activation of ERK. Non-normalized mean and SD of at least 29 HeLa cell traces are plotted against time. S17N traces are representative of ERK activity in cells with at least 500 fluorescence counts in the GFP channel, indicative of HRas-S17N expression. Data are not normalized to show the shift in ERK activity when the dominant negative HRas-S17N is present. Due to large shift in background upon media change, the difference between frames five and six were subtracted from all traces after frame six, and that frame was itself omitted from representation (indicated with a gray bar). (F) Ras GTP pull-down shows that treatment with 20 mM Zn2+ or EGF increases the amount of active GTP-bound Ras compared to treatment with buffer. Experiments in this figure were carried out in HeLa cells.

