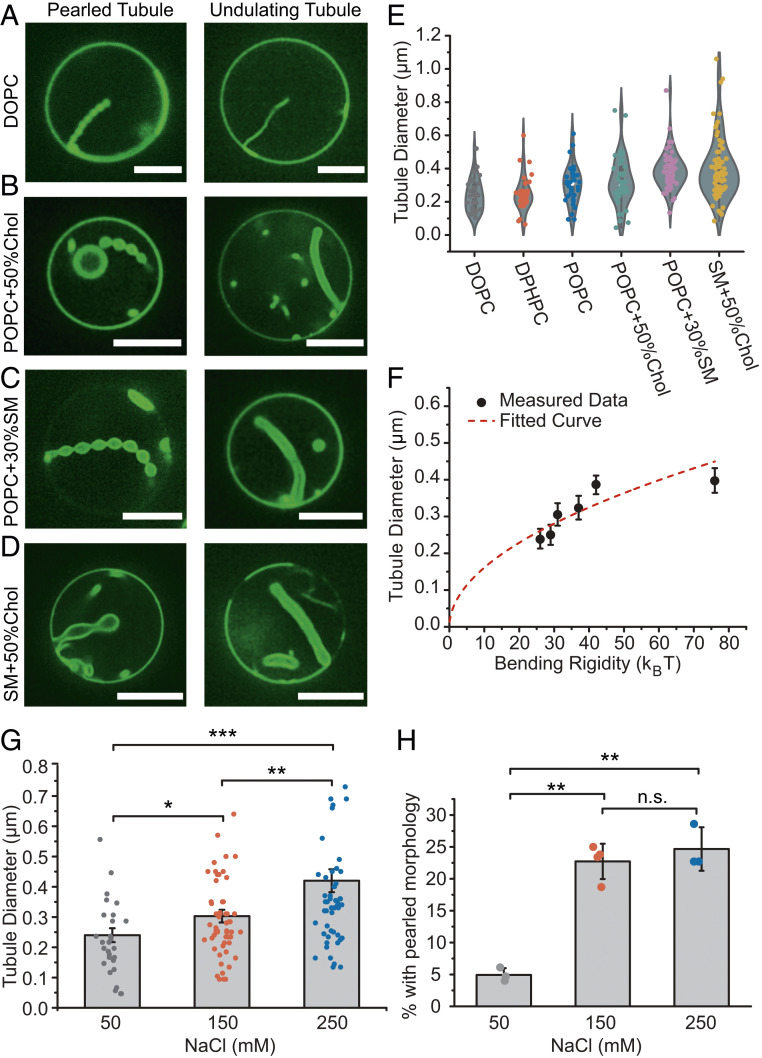
Fig. 4.
Tubule diameter varies with membrane bending rigidity and salt concentration. (A–F) Six groups of GUVs with different compositions (listed in SI Appendix, Table S4 and SI Appendix, Materials and Methods) were used to vary membrane bending rigidity. GUVs were incubated with 1 μM atto-488–labeled his-FUS LC in 25 mM Hepes, 150 mM NaCl, pH 7.4 buffer. (A–D) Representative superresolution confocal images tubules with pearled (Left) and undulating morphologies (Right), from GUVs consisting primarily of (A) DOPC, (B) POPC + 50% Chol, (C) POPC + 30% SM, and (D) SM + 50% Chol. (Scale bars, 5 μm.) (E) Violin plot showing the measured tubule diameter distribution for tubules formed using each GUV composition. (F) GUV tubule diameter as a function of membrane bending rigidity. Data points from left to right represent DOPC, DPHPC, POPC, POPC + 50% Chol, POPC + 30% SM, and SM + 50% Chol, respectively. Data are displayed as mean ± SE from at least 60 tubules per composition, gathered during three independent experiments. The measured tubule diameters increase roughly as the square root of membrane bending rigidity (red dash line, R2 = 0.64). (G) Bar chart displaying average tubule diameter under different NaCl concentrations. GUVs (composition: 83 mol% POPC, 15 mol% Ni-NTA, 2 mol% DP-EG10-biotin, and 0.1% Texas Red-DHPE) were incubated with 1 μM atto-488–labeled his-FUS LC in 25 mM Hepes, pH 7.4 buffer with corresponding NaCl concentration under iso-osmotic conditions. Error bars correspond to SE. Each point is a mean value of diameters measured at three positions along the same tubule. n > 100 GUVs were acquired cumulatively from three independent replicates for each condition. (H) Fraction of tubules that displayed a pearled morphology as a function of NaCl concentration. Data are displayed as mean ± SD from three independent experiments (n = 3) on separate preparations of vesicles, with cumulatively n > 100 vesicles categorized. Brackets show statistically significant comparisons using an unpaired, two-tailed Student’s t test. *P < 0.05, **P < 0.01, ***P < 0.001, and n.s. indicates a difference that was not statistically significant.

