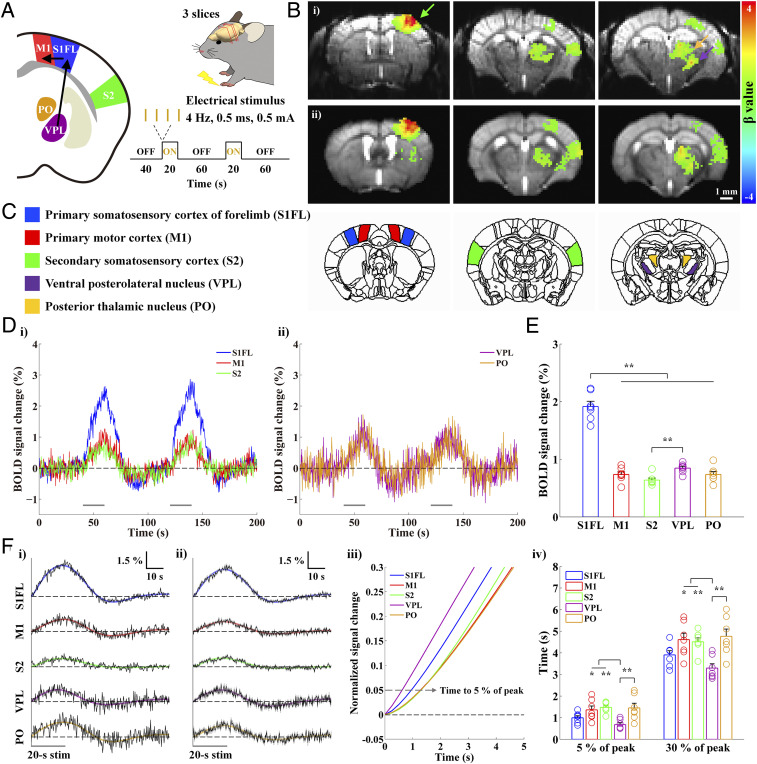
Fig. 1.
High spatiotemporal BOLD fMRI responses during forepaw stimulation in anesthetized mice reflect bottom-up processing in the somatosensory network. Well-known forepaw somatosensory stimulation was used to activate regions in the somatosensory network and investigate whether the temporal order of BOLD responses reflects the neural processing sequence. (A) Schematic of high temporal–resolution somatosensory fMRI. Three coronal EPI slices containing cortical and thalamic areas of the somatosensory network were acquired at 15.2 T with a TR of 250 ms during 20 s forepaw stimulation to measure bottom-up somatosensory processing (VPL → S1FL → M1). (B) Functional maps of one representative animal (i) and group-averaged data from seven animals (ii) were overlaid on the original EPI images. The somatosensory network contralateral to the stimulated side was activated (green arrow: S1FL; yellow arrow: PO; purple arrow: VPL). (C) Based on the somatosensory fMRI map, five different ROIs were defined using the Allen mouse brain atlas. (D) fMRI time courses of group-averaged data were obtained from the ROIs contralateral to the somatosensory stimulation in the three cortical (i; S1FL, blue; M1, red; S2, green) and two thalamic regions (ii; VPL, purple; PO, yellow). The BOLD responses follow the two 20 s stimulation periods. (E) Mean signal changes were obtained from averages between 6 and 20 s after the onset of stimulation. Clearly, the S1FL response is the highest during forepaw stimulation. (F) The fMRI time courses during two stimulus blocks were averaged (black) and fitted by double gamma variate functions (S1FL, blue; M1, red; S2, green; VPL, purple; PO, yellow) to determine the HRFs (i for the representative animal shown in B, i; ii for group-averaged data from the seven animals shown in B, ii). The fitting curves were normalized to the peak (iii; showing from 0 to 5 s after stimulus onset), and the times to reach 5% and 30% of the peak were then measured in all ROIs (iv). The order of early BOLD responses to somatosensory stimulation is VPL → S1FL → PO/M1/S2. Gray horizontal bar, 20 s stimulus duration; error bars in E and F, iv and gray shades in F, ii: SEM; colored circles in E and F, iv: individual animal data; *P < 0.05 and **P < 0.01 in E and F, iv (n = 7; one-way ANOVA with repeated measures followed by Tukey’s post hoc test).

