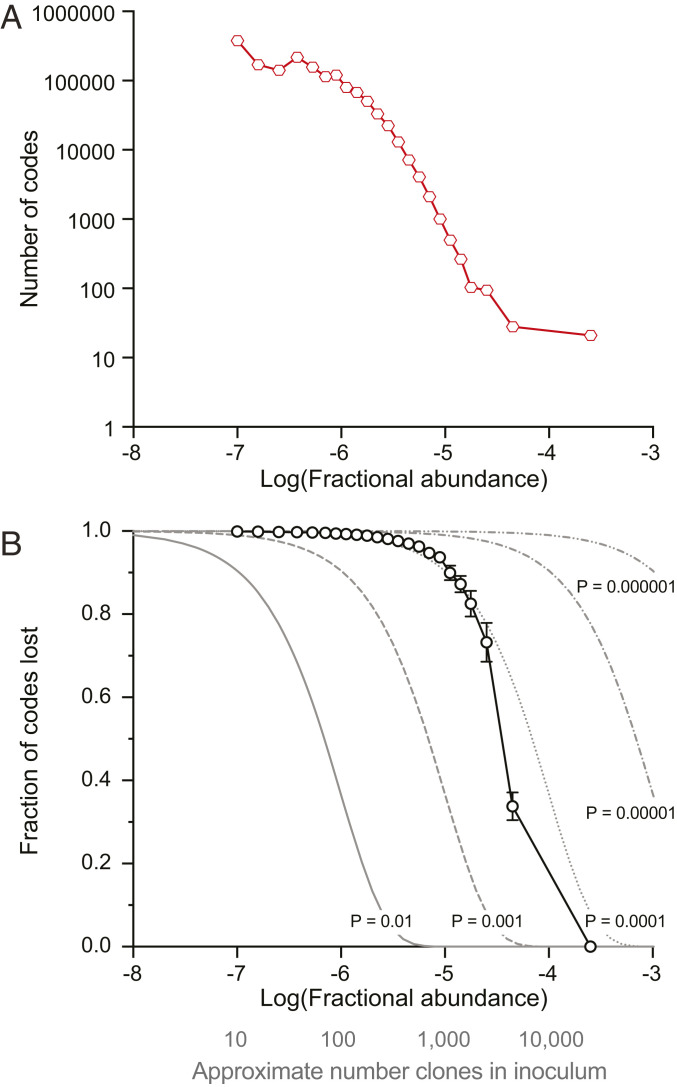
Fig. 5.
Lymph node colonization by individual B. abortus strains is a function of abundance in the inoculum and follows a binomial probability. (A) Barcodes (i.e., unique strains) were binned by fractional abundance in the inoculum. The number of barcodes in each bin is plotted where abundance corresponds to the center of the bin. (B) Fraction of strains not detected in parotid lymph node samples (i.e., lost during infection) are plotted as a function of barcode abundance in the inoculum. The presence or absence of each barcode was recorded for each parotid lymph node. Mean (± SD) fraction of codes not detected in each bin is plotted in black (n = 12 parotid lymph nodes). Gray lines represent expected fractions of codes not detected assuming a binomial sampling at different probabilities (P). To simulate a binomial sampling, the fractional strain abundance in the inoculum was converted to an approximate number of strains in the inoculum (fractional abundance * 108 CFU in inoculum; gray axis label) and used as the number of trials.

