Fig. 2.
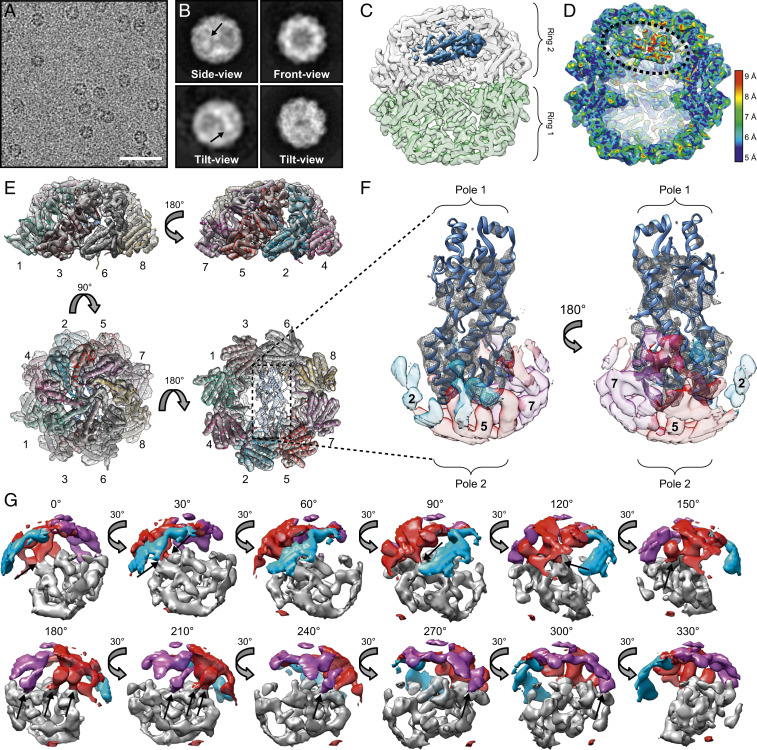
Cryoelectron microscopy reveals σ3 in a near-native conformation in the closed TRiC folding chamber. (A) Electron micrograph of ice-embedded TRiC/σ3 complex. (Scale bar: 50 nm.) (B) Selected 2D reference-free averages showing top, side, and tilt views of TRiC/σ3. Arrows indicate extra density. (C) Single model refinement of closed TRiC/σ3 complex with diffuse densities of σ3 shown in blue. A slight cut-through view of the top TRiC ring (white) and bottom TRiC ring (green) are displayed so that σ3 density within the chamber can be visualized. (D) A cut-through view of the local resolution map of the TRiC/σ3 complex. Dotted line encircles σ3 density. (E) Single molecule refinement of TRiC/σ3 overlaying secondary structure of CCT1 to CCT8 subunits shown in different colors from a single TRiC ring containing the σ3 density. (F) Single molecule of σ3 with ribbon tracing (Protein Data Bank: 1FN9) and overlying density mesh with transparent surface density maps of CCT2 (light blue), CCT5 (red), and CCT7 (purple). (G) Surface density focused on σ3 pole 2 (gray), CCT2 (blue), CCT5 (red), and CCT7 (purple) rotated 330°. Arrows indicate overlapping σ3/CCT density.

