Fig. 3.
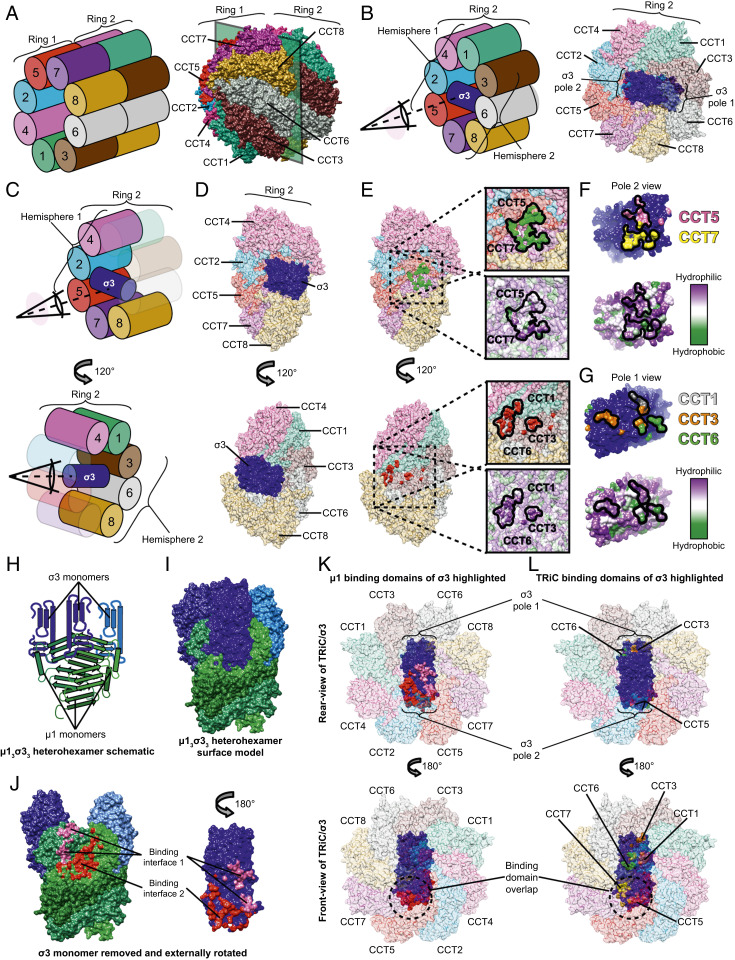
σ3 bridges two TRiC hemispheres with its oligomerization domain oriented toward the center of the folding chamber. (A) Schematic (Left) and structural model (Right) of the complete TRiC/σ3 complex in an oblique orientation. (B) Schematic (Left) and structural model (Right) of TRiC/σ3 complex with ring 1 omitted, allowing visualization of σ3. (C and D) Schematic (C) and structural model (D) of σ3 bound to TRiC. Top images omit CCT1,3,6 and Bottom images omit CCT2,5,7. (E) Identical to D except with σ3 removed, revealing the interaction interface. In the Top image, surface residues of CCT5 and CCT7 in proximity to σ3 are colored green. In the Bottom image, surface residues of CCT1,3,6 in proximity to σ3 are colored red. TRiC surface hydrophobicity maps are shown in expanded views with the interaction interface encircled. (F and G) σ3 protein rotated 180° relative to its position in D (Top) image (F) or D (Bottom) image (G). σ3 residues in proximity to CCT5 and CCT7 are colored pink and yellow, respectively. Residues in proximity to CCT1,3,6 are colored gray, orange, and green, respectively. Surface hydrophobicity plots are shown below. (H and I) Schematic (H) and surface (I) representation of µ13σ33 heterohexamer (Protein Data Bank: 1JMU). (J) µ13σ33 heterohexamer with the proximal σ3 monomer removed and externally rotated. Surface residues forming contacts in the μ1/σ3 interface are colored pink and red. (K and L) Rear view (Top) and front view (Bottom) of TRiC/σ3 complex with μ1 (K) or TRiC (L) interaction surfaces highlighted.

