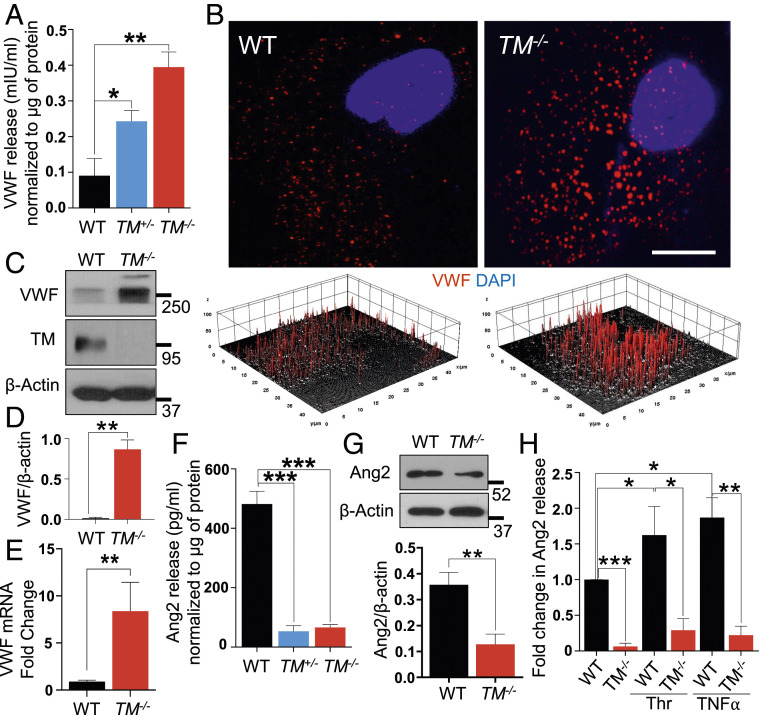
Fig. 4.
Deficiency of TM leads to increased expression and release of VWF. (A) Levels of VWF in the medium supernatant collected from confluent WT, TM+/−, and TM−/− cells were measured by a sandwich ELISA. (B) Confluent WT and TM−/− cells were fixed, permeabilized, and stained with rabbit anti‐VWF antibody and Alexa Fluor 568–conjugated goat anti‐rabbit IgG. The nucleus was stained with Hoechst 33342. Immunofluorescence images were obtained with confocal microscopy. A three-dimensional surface plot of VWF particles in the cytoplasm, constructed with ImageJ software, is presented below B. (Scale bar, 10 μm.) (C) Confluent WT and TM−/− cells were lysed, and protein levels of VWF, TM, and β-actin were analyzed by Western blotting. (D) Quantitation of VWF protein levels inside the cells normalized to β-actin. (E) Changes in VWF RNA transcripts in WT and TM−/− cells were measured by qRT-PCR. GAPDH was used as an internal control for quantitation. (F) Levels of Ang2 in the medium supernatant, collected from the same cells mentioned in A. (G) Protein levels of Ang2 and β-actin in confluent WT and TM−/− cells were measured by Western blotting along with the quantitation. (H) Levels of Ang2 in the medium supernatant, collected from confluent WT and TM−/− cells, treated with thrombin (10 nM) or TNF-α (100 ng/mL) for 16 h, were measured by a sandwich ELISA. Data are mean ± SEM (n = 3). One-way ANOVA: *P < 0.05, **P < 0.01, and ***P < 0.001.

