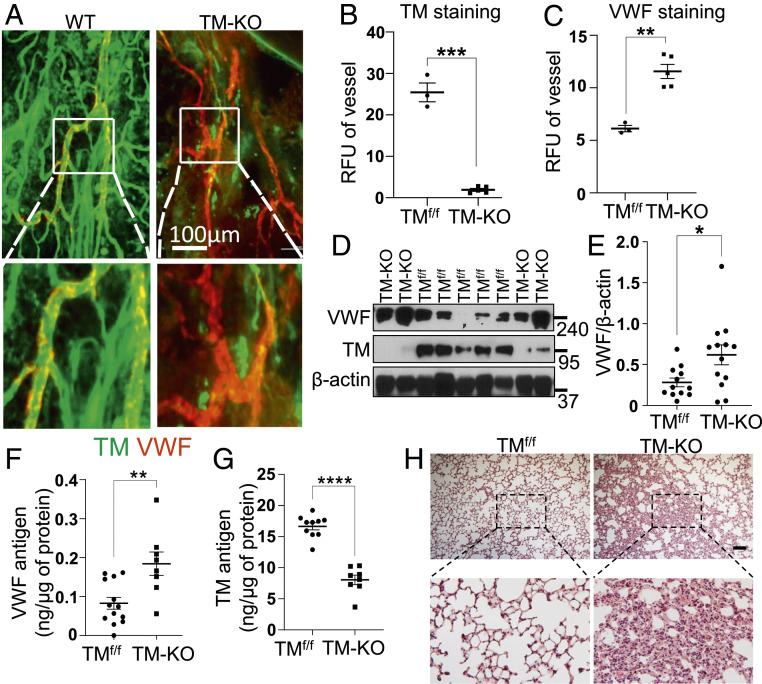
Fig. 6.
Increased expression of VWF in the trachea vessels and lungs in TM-KO mice. (A) Tracheal blood vessels visualized by TM and VWF immunostaining of TMf/f and TM-KO mice. The inset boxes from each group are magnified. Note the prominent expression of VWF in veins (shown in the inset box). (Scale bar, 100 μm.) (B and C) Relative fluorescence intensity units (RFU) of TM and VWF in tracheal vessels analyzed by ImageJ in TMf/f (n = 3) and TM-KO (n = 5) mice. (D) Lung lysates from TMf/f and TM-KO mice were analyzed for protein levels of TM, β-actin, and VWF by Western blotting. (E) Quantitation of VWF normalized to β-actin in WT (n = 12) and TM-KO (n = 13) mice. (F) Tissue antigen levels of VWF in TMf/f (n = 13) and TM-KO (n = 8) mice measured by a sandwich ELISA. (G) TM antigen levels in the lung lysates of TMf/f (n = 10) and TM-KO (n = 8) mice were measured by a sandwich ELISA. (H) Representative images (10×) of H&E staining of the lung tissue sections from TMf/f and TM-KO mice. The inset boxes from each group are magnified. (Scale bar, 200 μm.) Data are mean ± SEM (n = 3). t test: *P < 0.05, **P < 0.01, ***P < 0.001, and ****P < 0.001.

