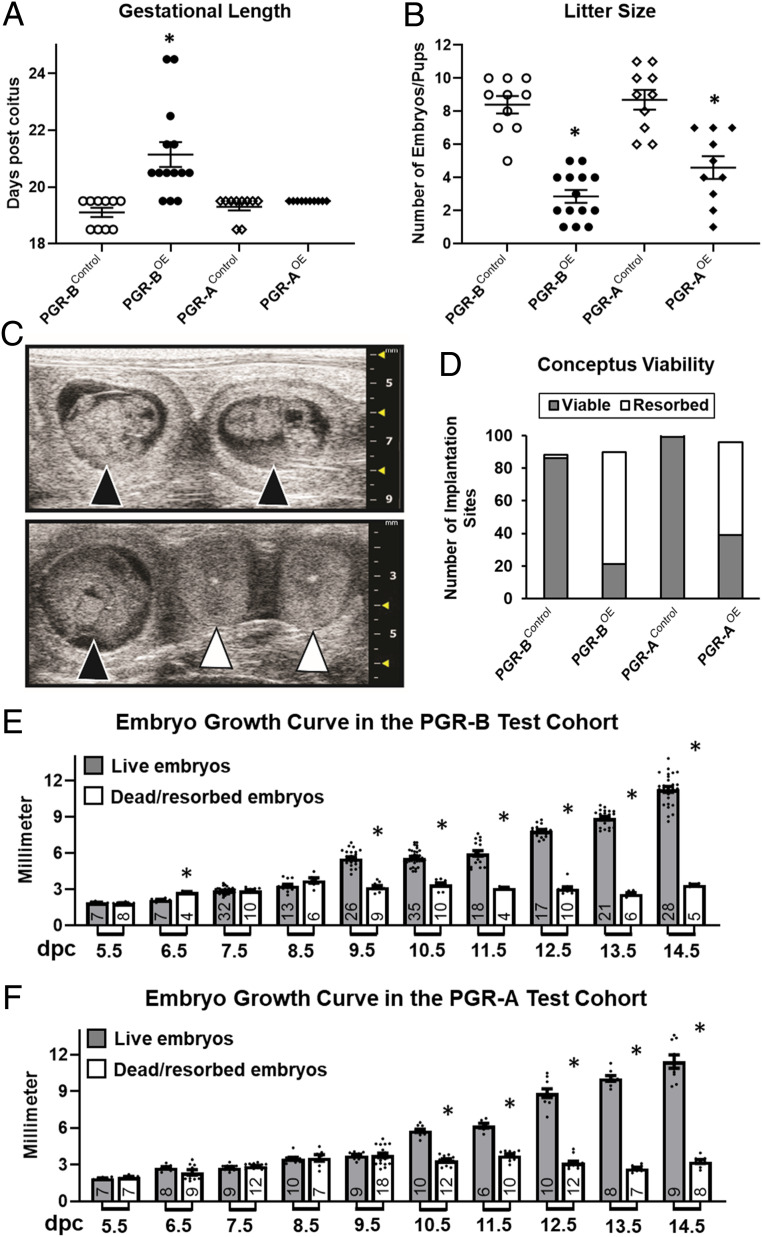
Fig. 1.
Pregnancy impact by PGR isoform overexpression. (A) Gestational length and (B) litter sizes of the first litters from females of denoted genotypes. Gestation length is defined by the time of spontaneous parturition and ethics-related euthanasia. n = 10 (PGR-BControl), 14 (PGR-BOE), 10 (PGR-AControl), and 10 (PGR-AOE). *P < 0.05 in comparison with the corresponding control group by the two-tailed Mann–Whitney U test. (C) Representative ultrasound images of alive (black arrowheads) and resorbed (white arrowheads) embryos at 10.5 dpc. (D) Viability of embryos up to 18.5 determined by ultrasound. n = 88 (PGR-BControl), 90 (PGR-BOE), 103 (PGR-AControl), and 96 (PGR-AOE) total embryos examined. (E and F) Fetal growth curves in vivo by ultrasound. (E) Summary of PGR-BOE and PGR-BControl embryos. (F) Collective measurement of PGR-AOE and PGR-AControl fetuses. Filled bars denote viable fetuses and empty columns represent resorbed embryos. Numbers of datapoints are located at the bottom of each columns. Error bars denote SEM. *P < 0.05 between viable and resorbed embryos at the same gestation day by two-tailed Student’s t test.

