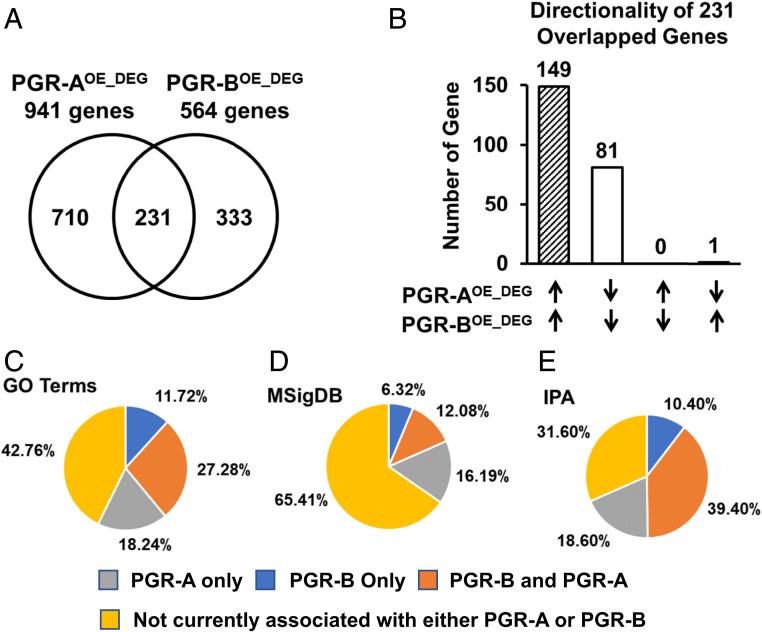
Fig. 4.
Transcriptomic profiles of PGR-A and PGR-B overexpression uteri. (A) Common and distinct genes that are modulated by PGR-AOE and PGR-BOE in comparison to the Myh11Cre, respectively, shown in a Venn diagram. (B) A comparison on the effect of PGR-A– and PGR-B–dependent gene regulation in the 231 genes whose expression were altered by both PGR isoforms. (C–E) Percentages of enriched myometrial remodeling biological processes in association with PGR-A– and PGR-B–dependent genome regulation. Overrepresentation of gene annotations was determined by GO (C), MSigDB canonical pathways (D), and IPA Diseases and Functions (E). Differentially expressed genes between gestation day 14 and virgin mouse myometrium (GSE17021) were used to identify enriched myometrial remodeling biological processes.

