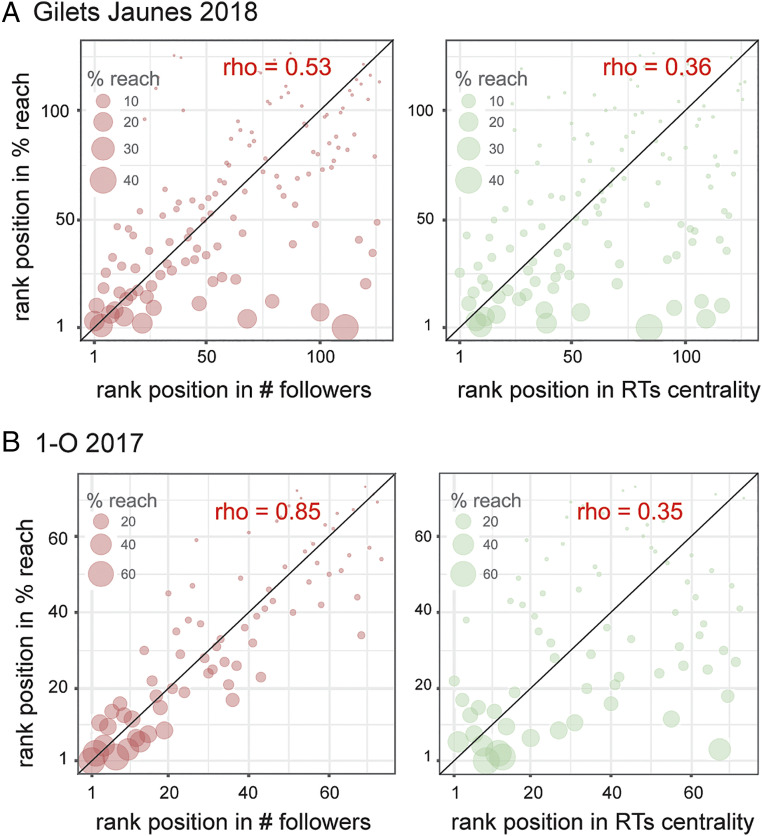
Fig. 3.
Correlation of rank position in percentage reach (web) and RT centrality. Panel A shows correlations for the Yellow Vests data; panel B shows correlations for the Catalan Referendum data. The scatterplots on the Left column measure the association between audience reach on the web and number of followers on Twitter; the scatterplots on the Right measure the association of reach with number of RTs received in the stream of information related to the protests. For the latter, the correlation coefficients show that the association is weak: The most accessed news sources on the web are not the most of salient in the Twitter stream covering the mobilizations (even though the most accessed web sources tend to also have a higher number of followers).

